figure 1.
Experimental setup [own recording, editing].
figure 1.
Experimental setup [own recording, editing].
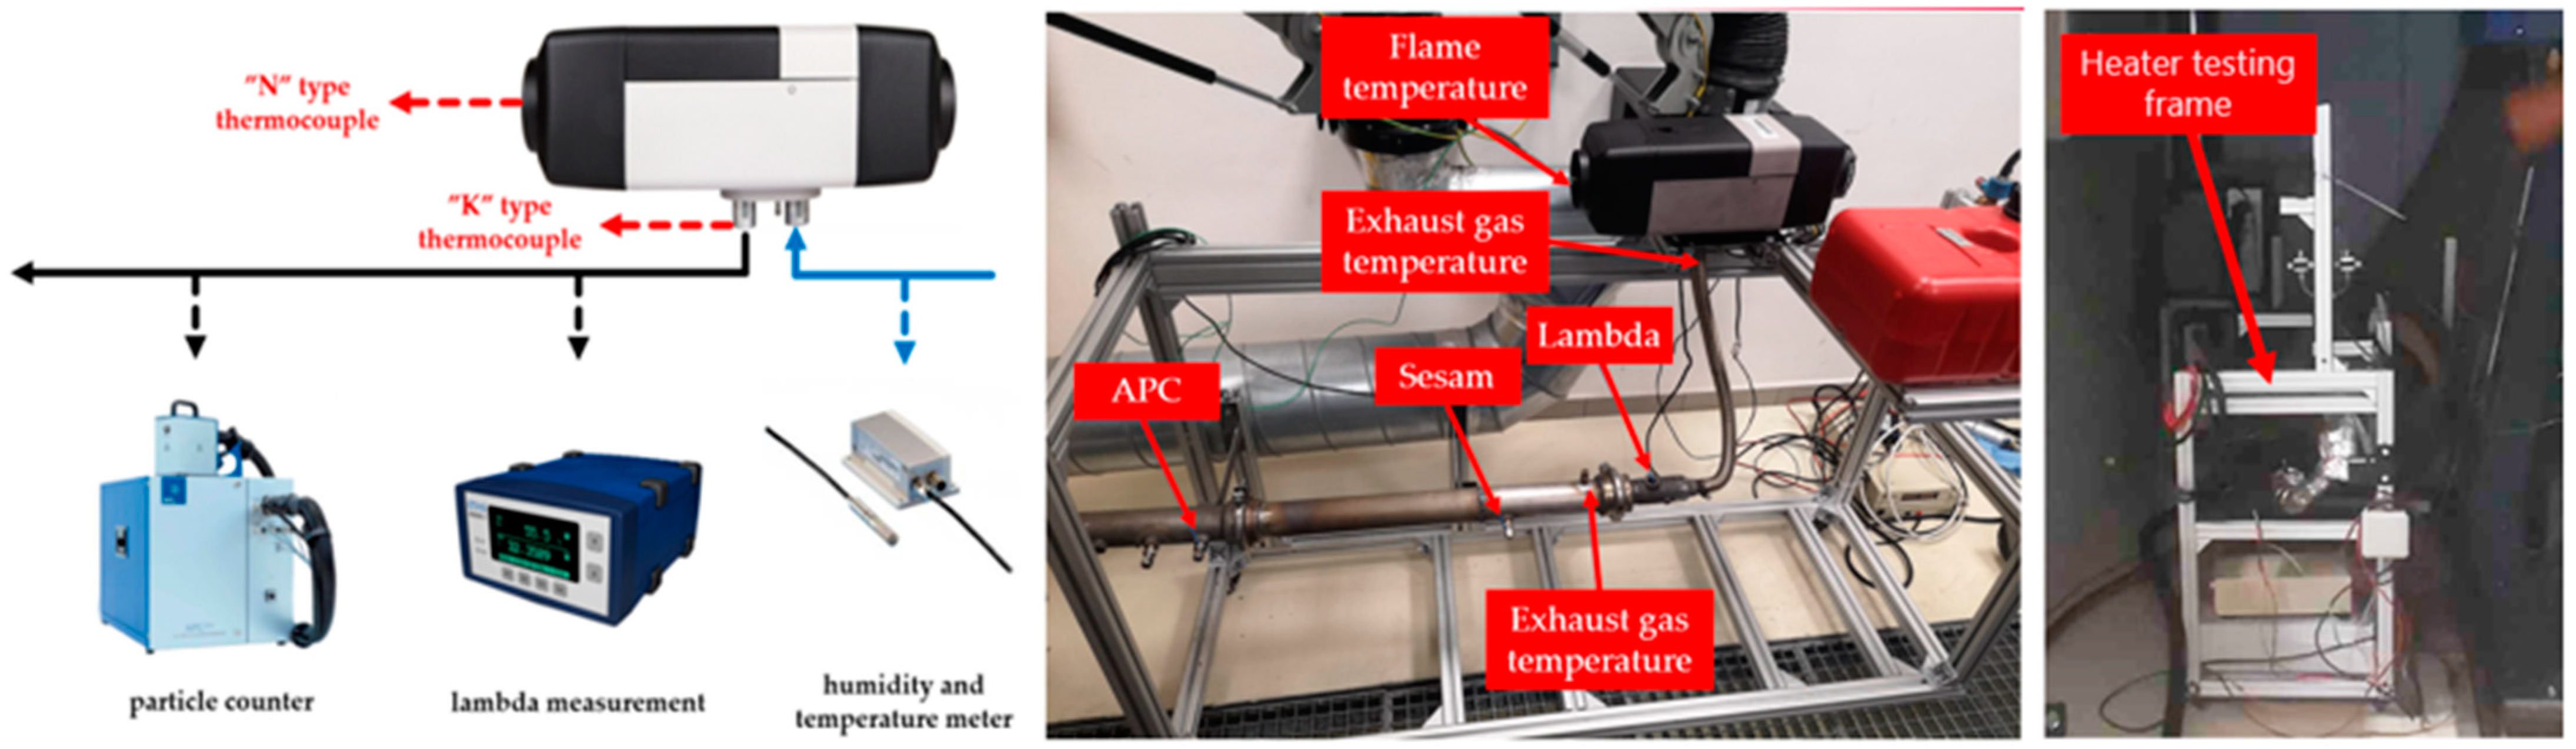
figure 2.
Dry matter content samples and location for analysis [own editing].
figure 2.
Dry matter content samples and location for analysis [own editing].
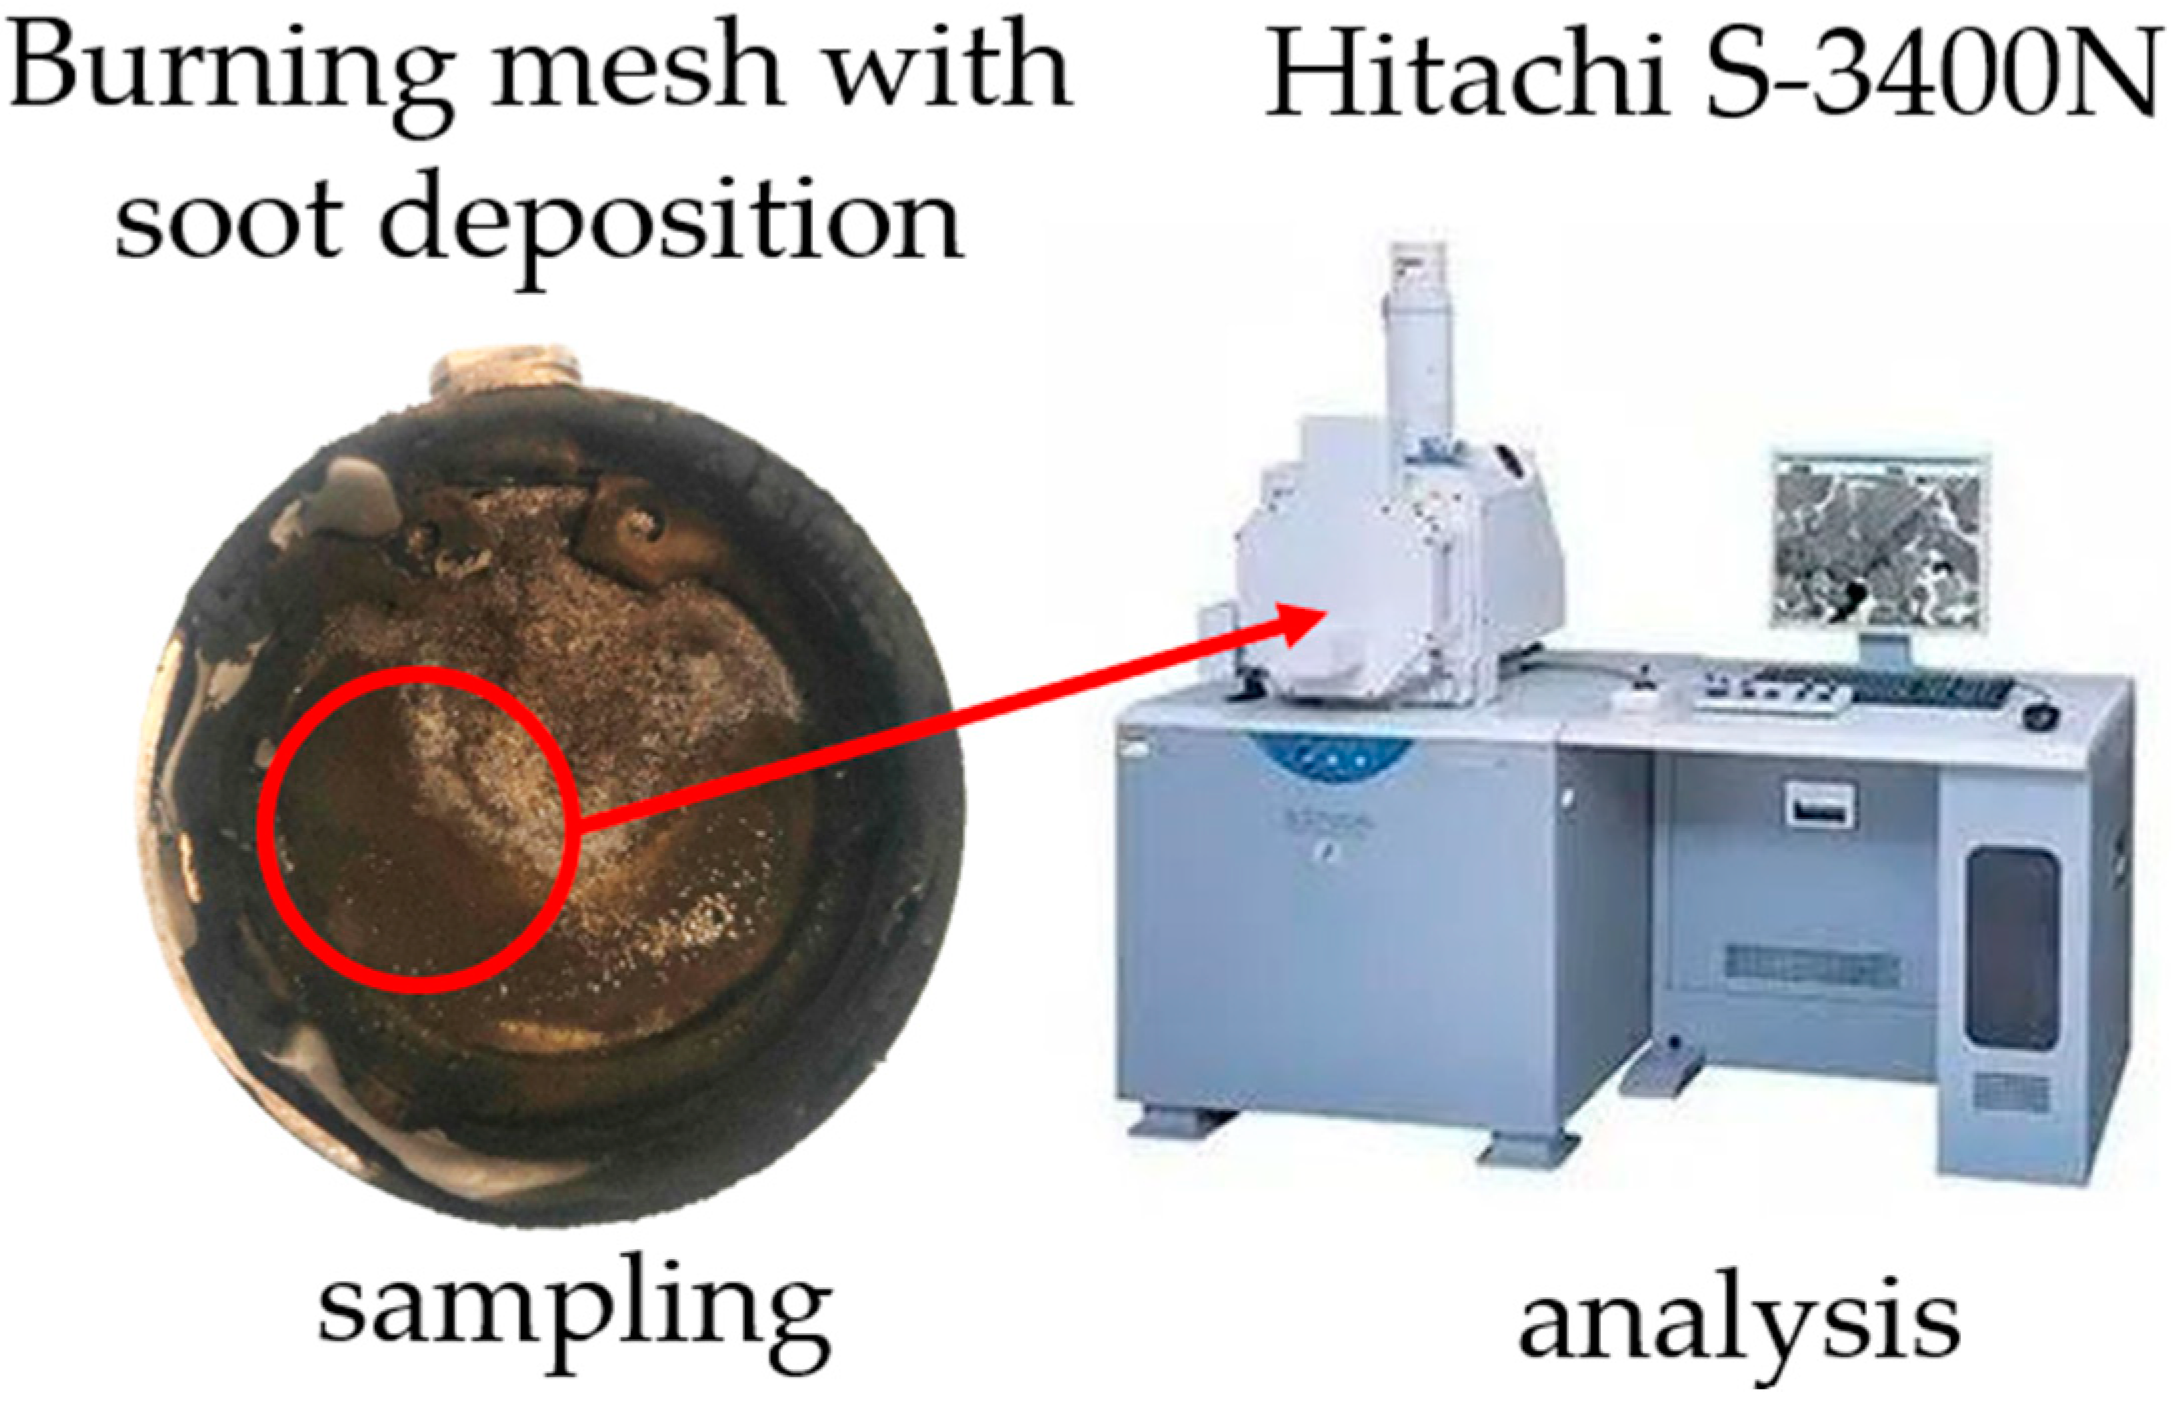
image 3.
Construction of fuel-air heaters and mixture-forming related components [own recording, editing].
image 3.
Construction of fuel-air heaters and mixture-forming related components [own recording, editing].
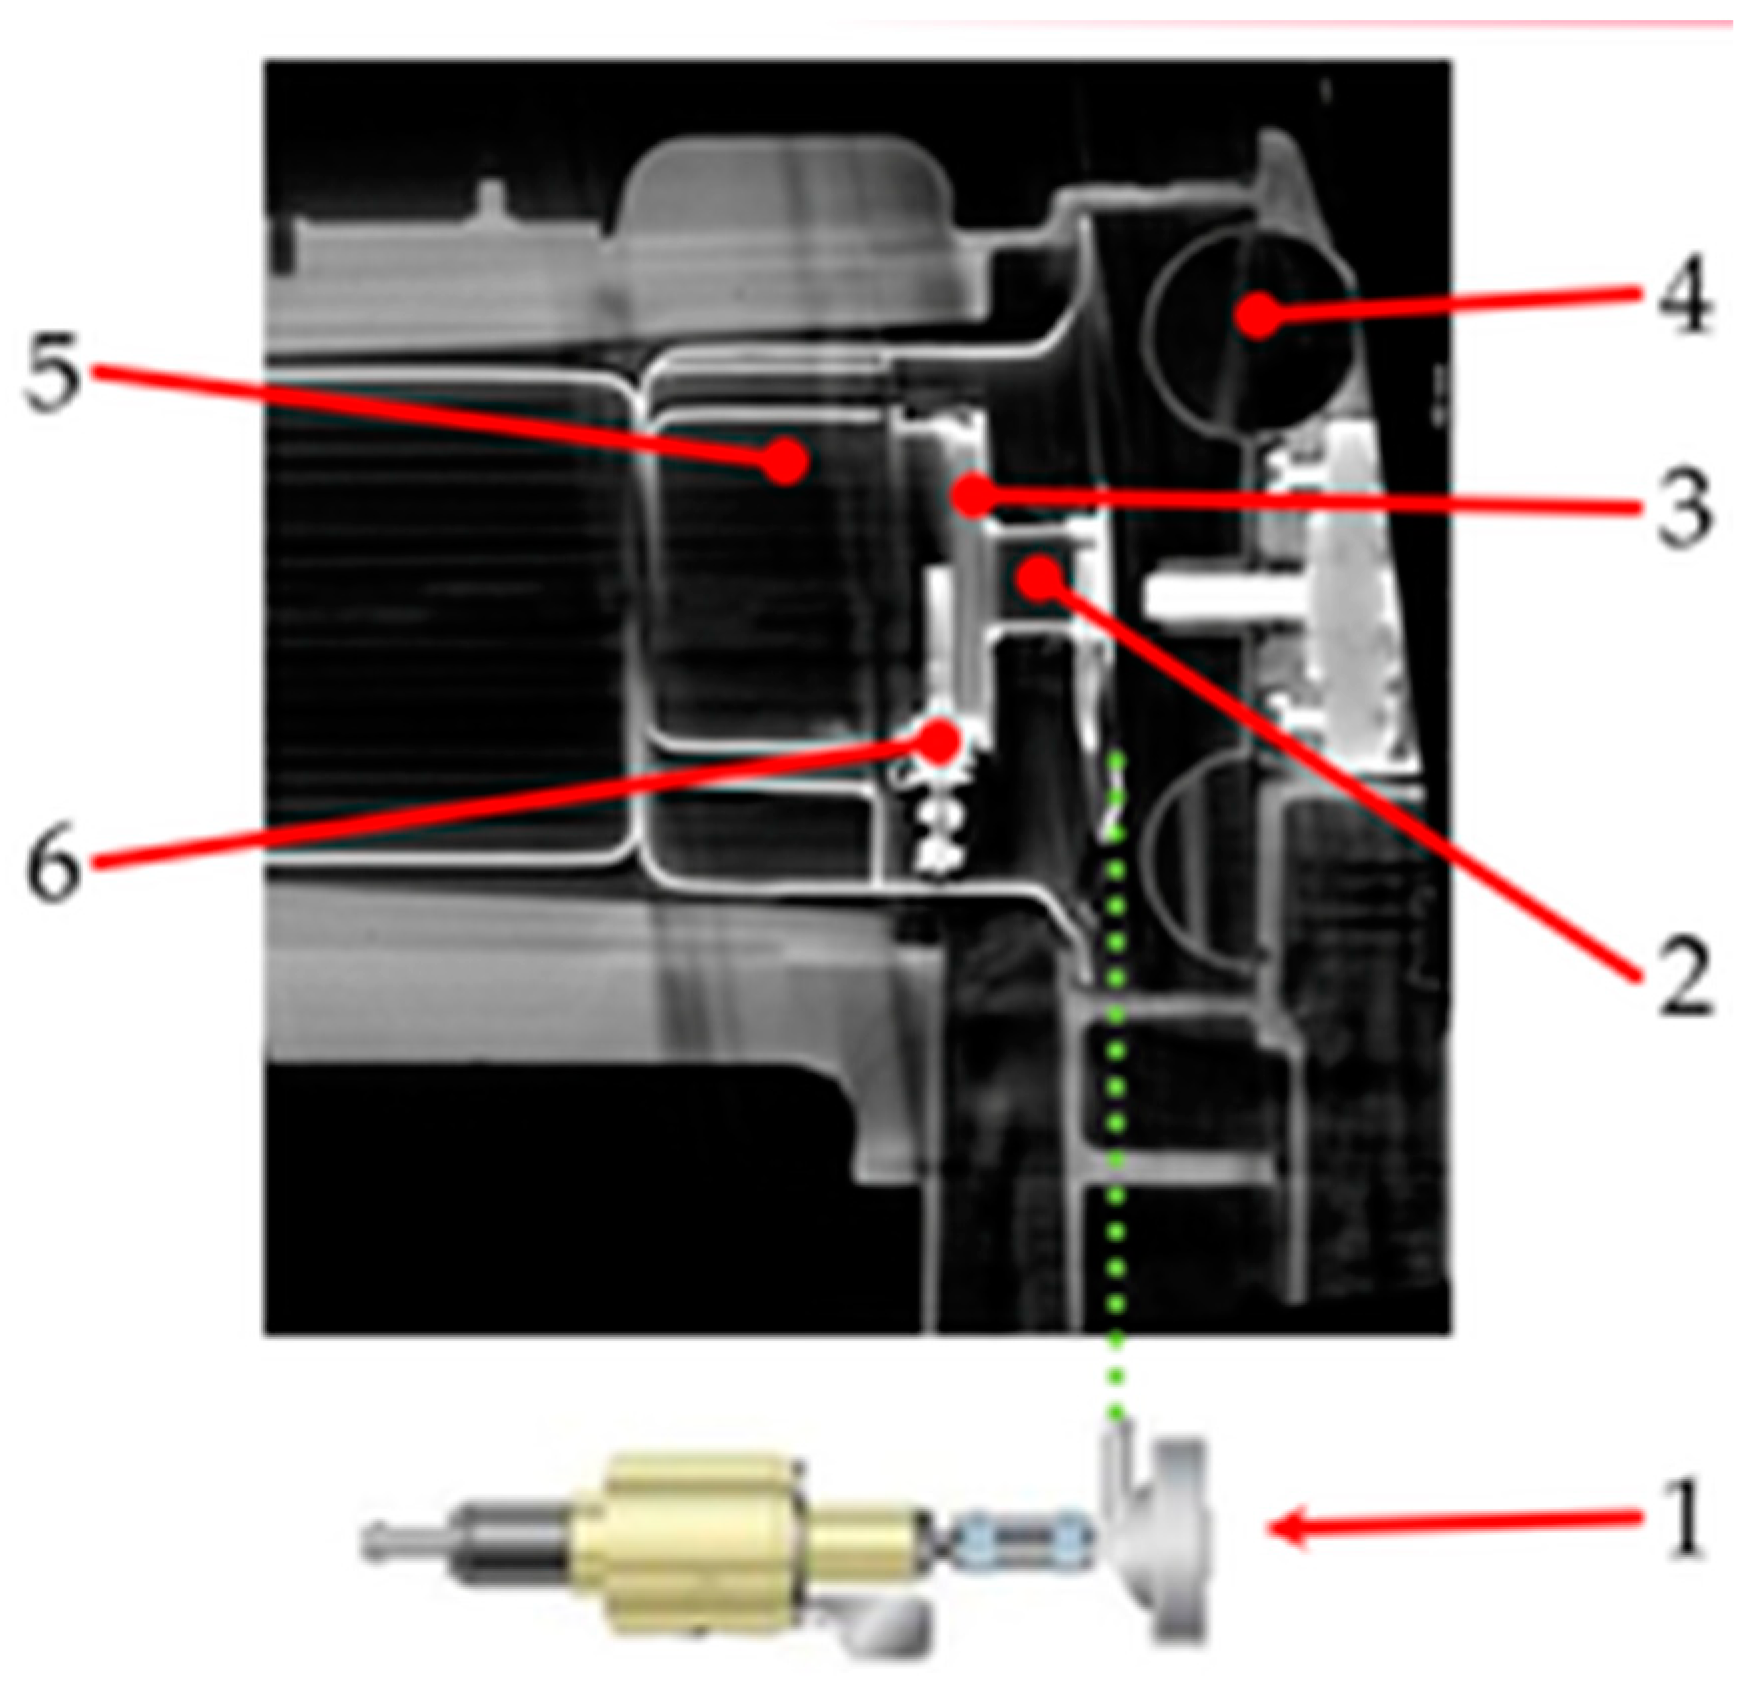
Figure 4.
Particle number concentration of fuels (E10, E30 and E100) during the cycle.
Figure 4.
Particle number concentration of fuels (E10, E30 and E100) during the cycle.
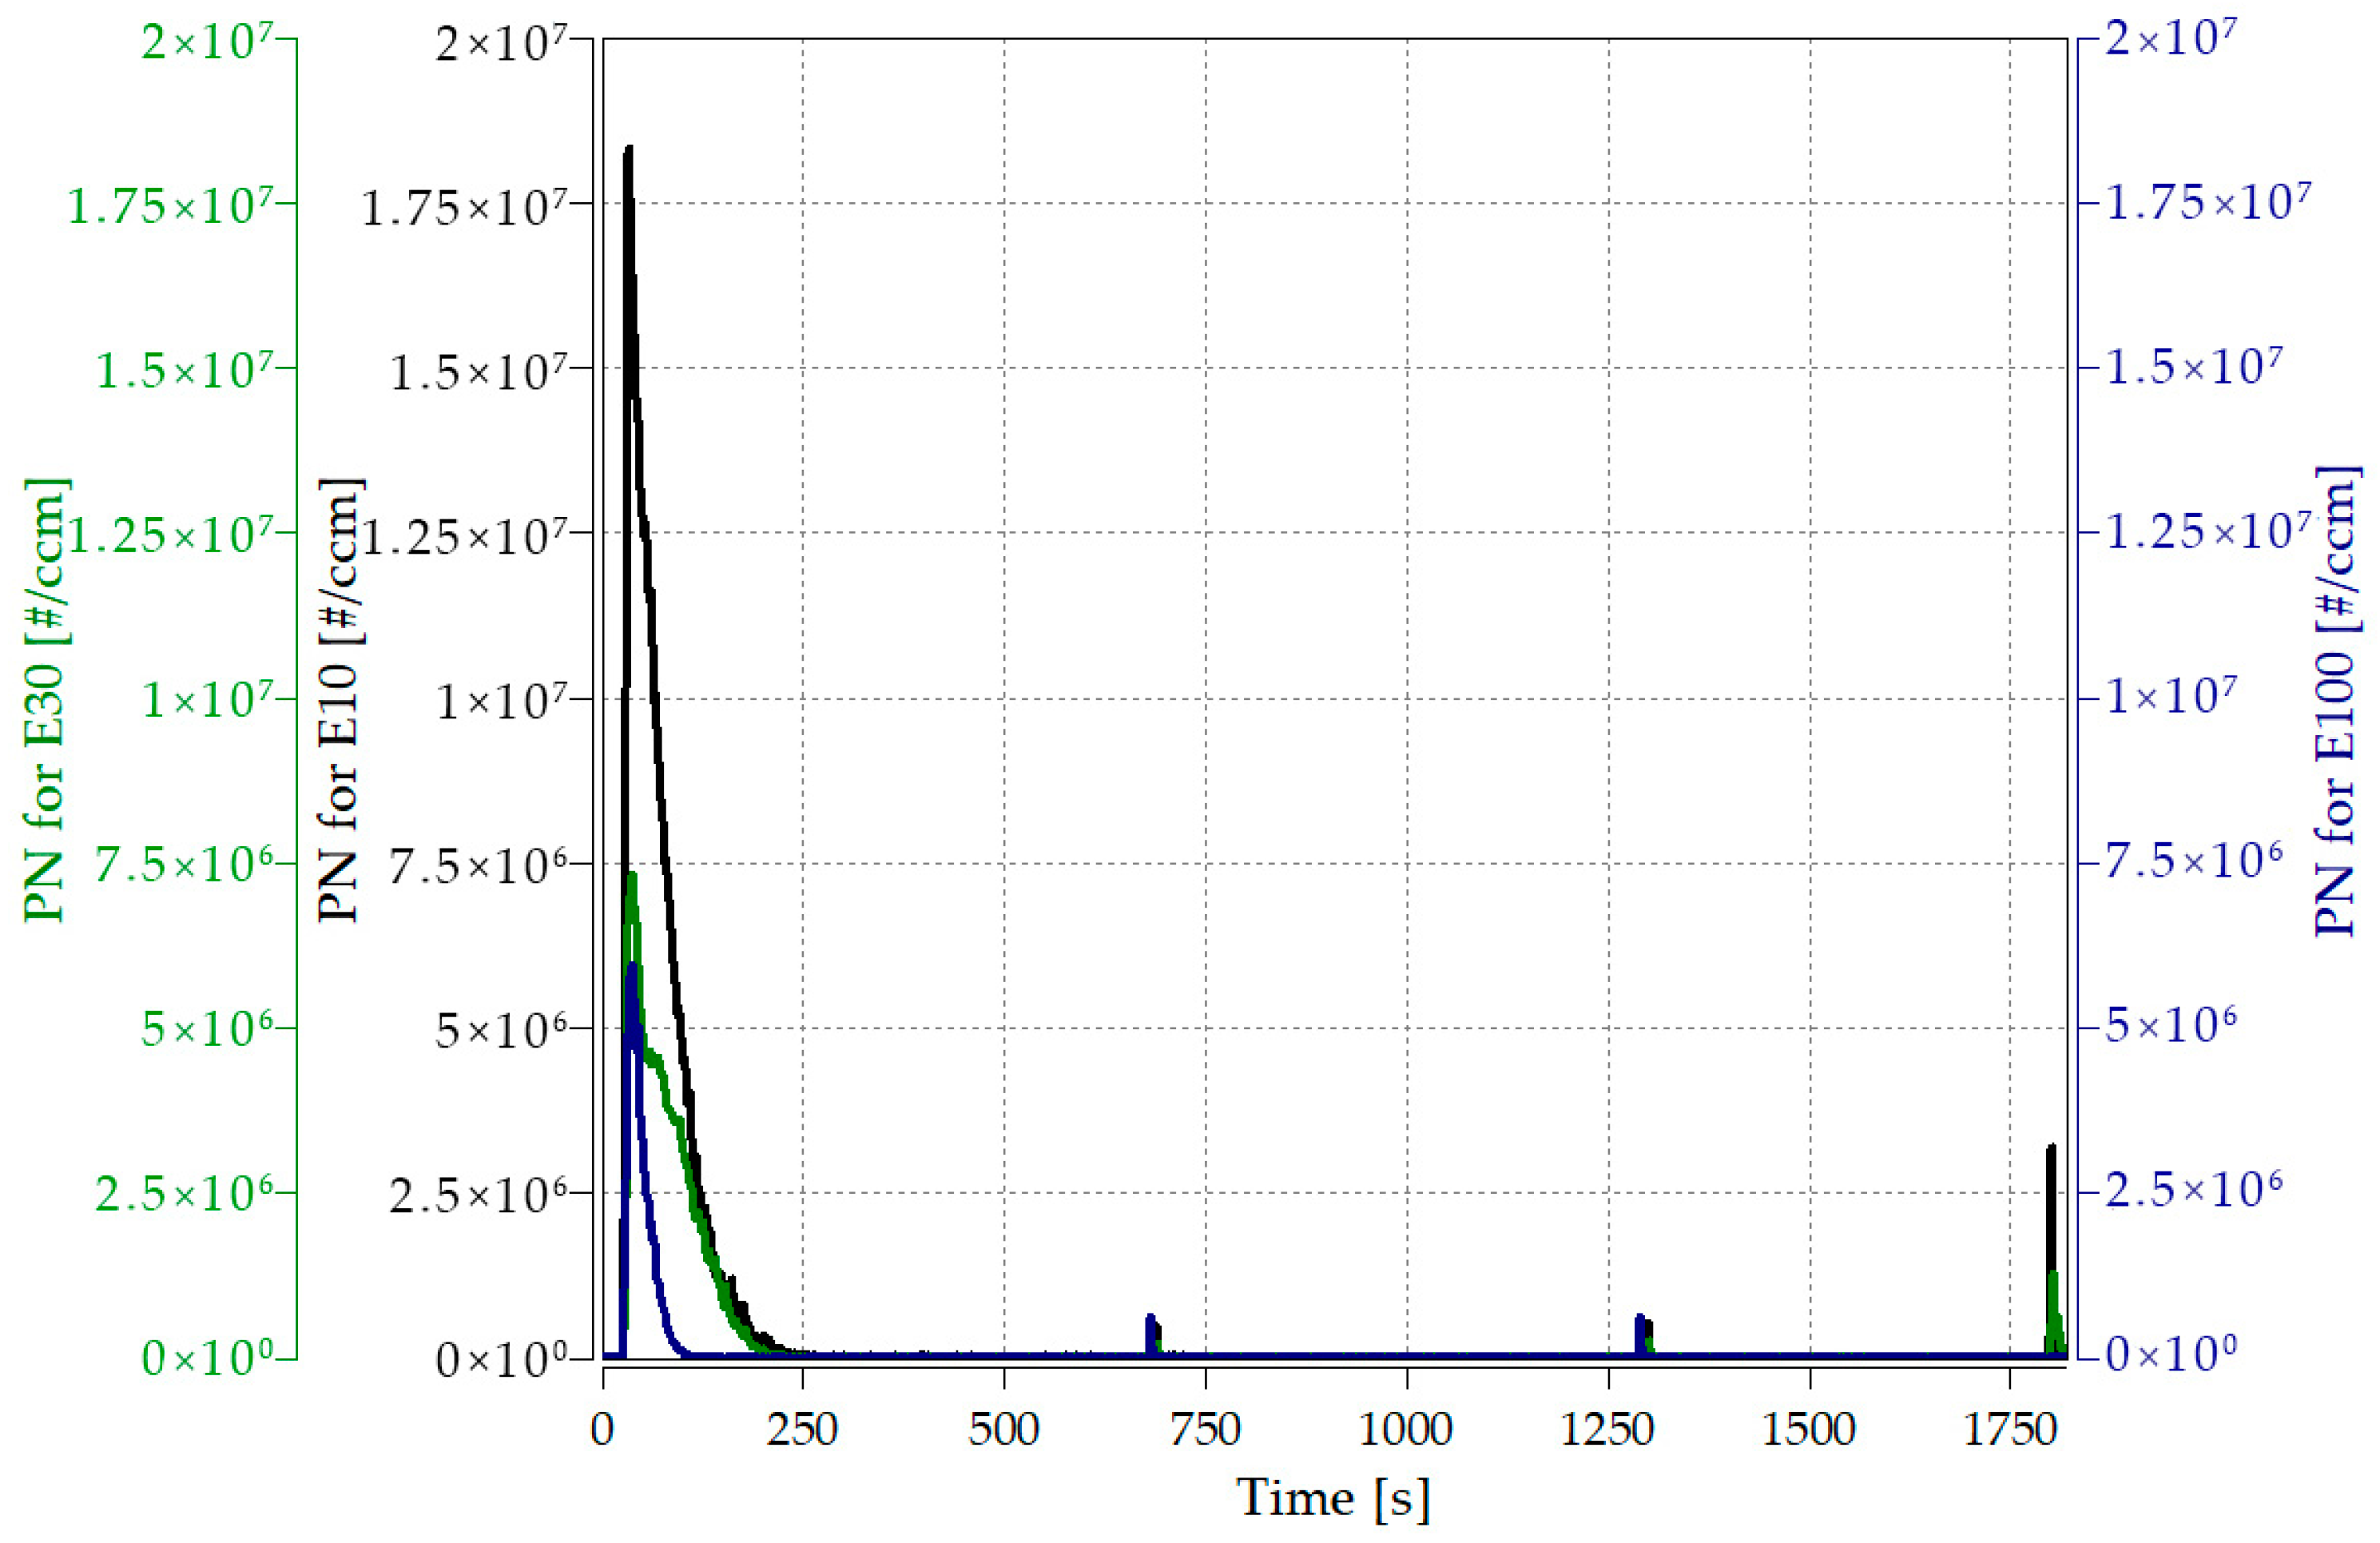
Figure 5.
Total particulate matter emissions from different fuels.
Figure 5.
Total particulate matter emissions from different fuels.
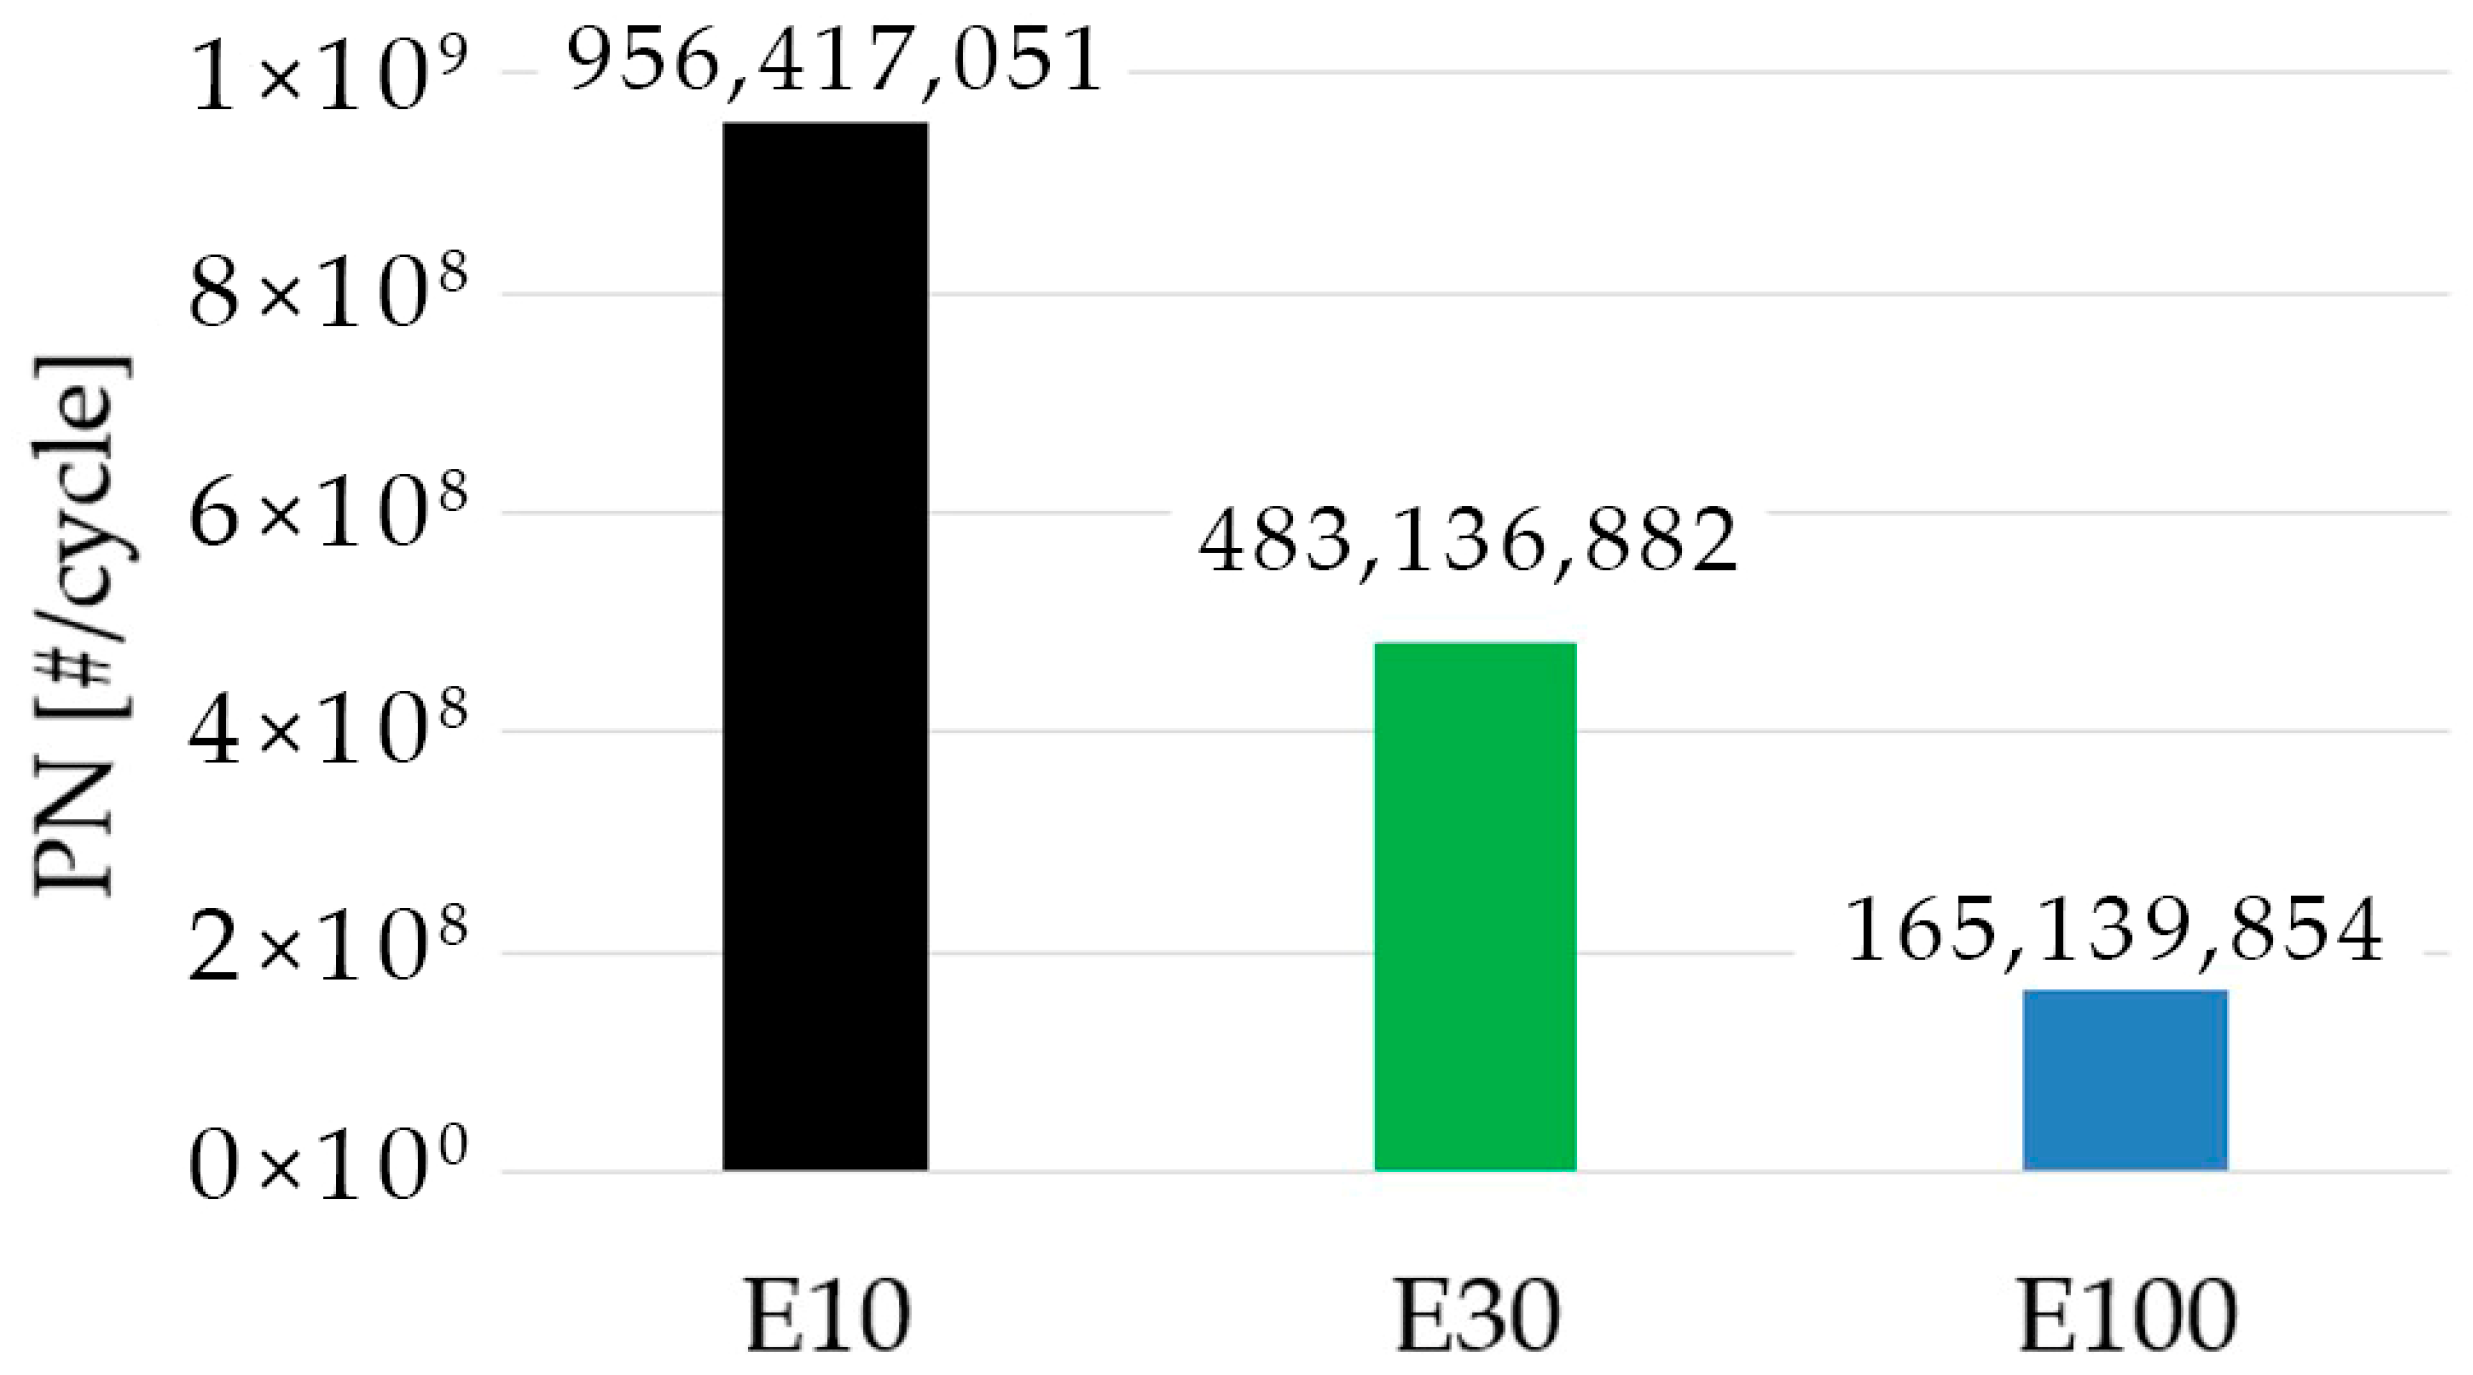
Figure 6.
Change in lambda value (upper part) as the ethanol content increases and the fuel pump and fan control signals (lower part) during the startup phase.
Figure 6.
Change in lambda value (upper part) as the ethanol content increases and the fuel pump and fan control signals (lower part) during the startup phase.
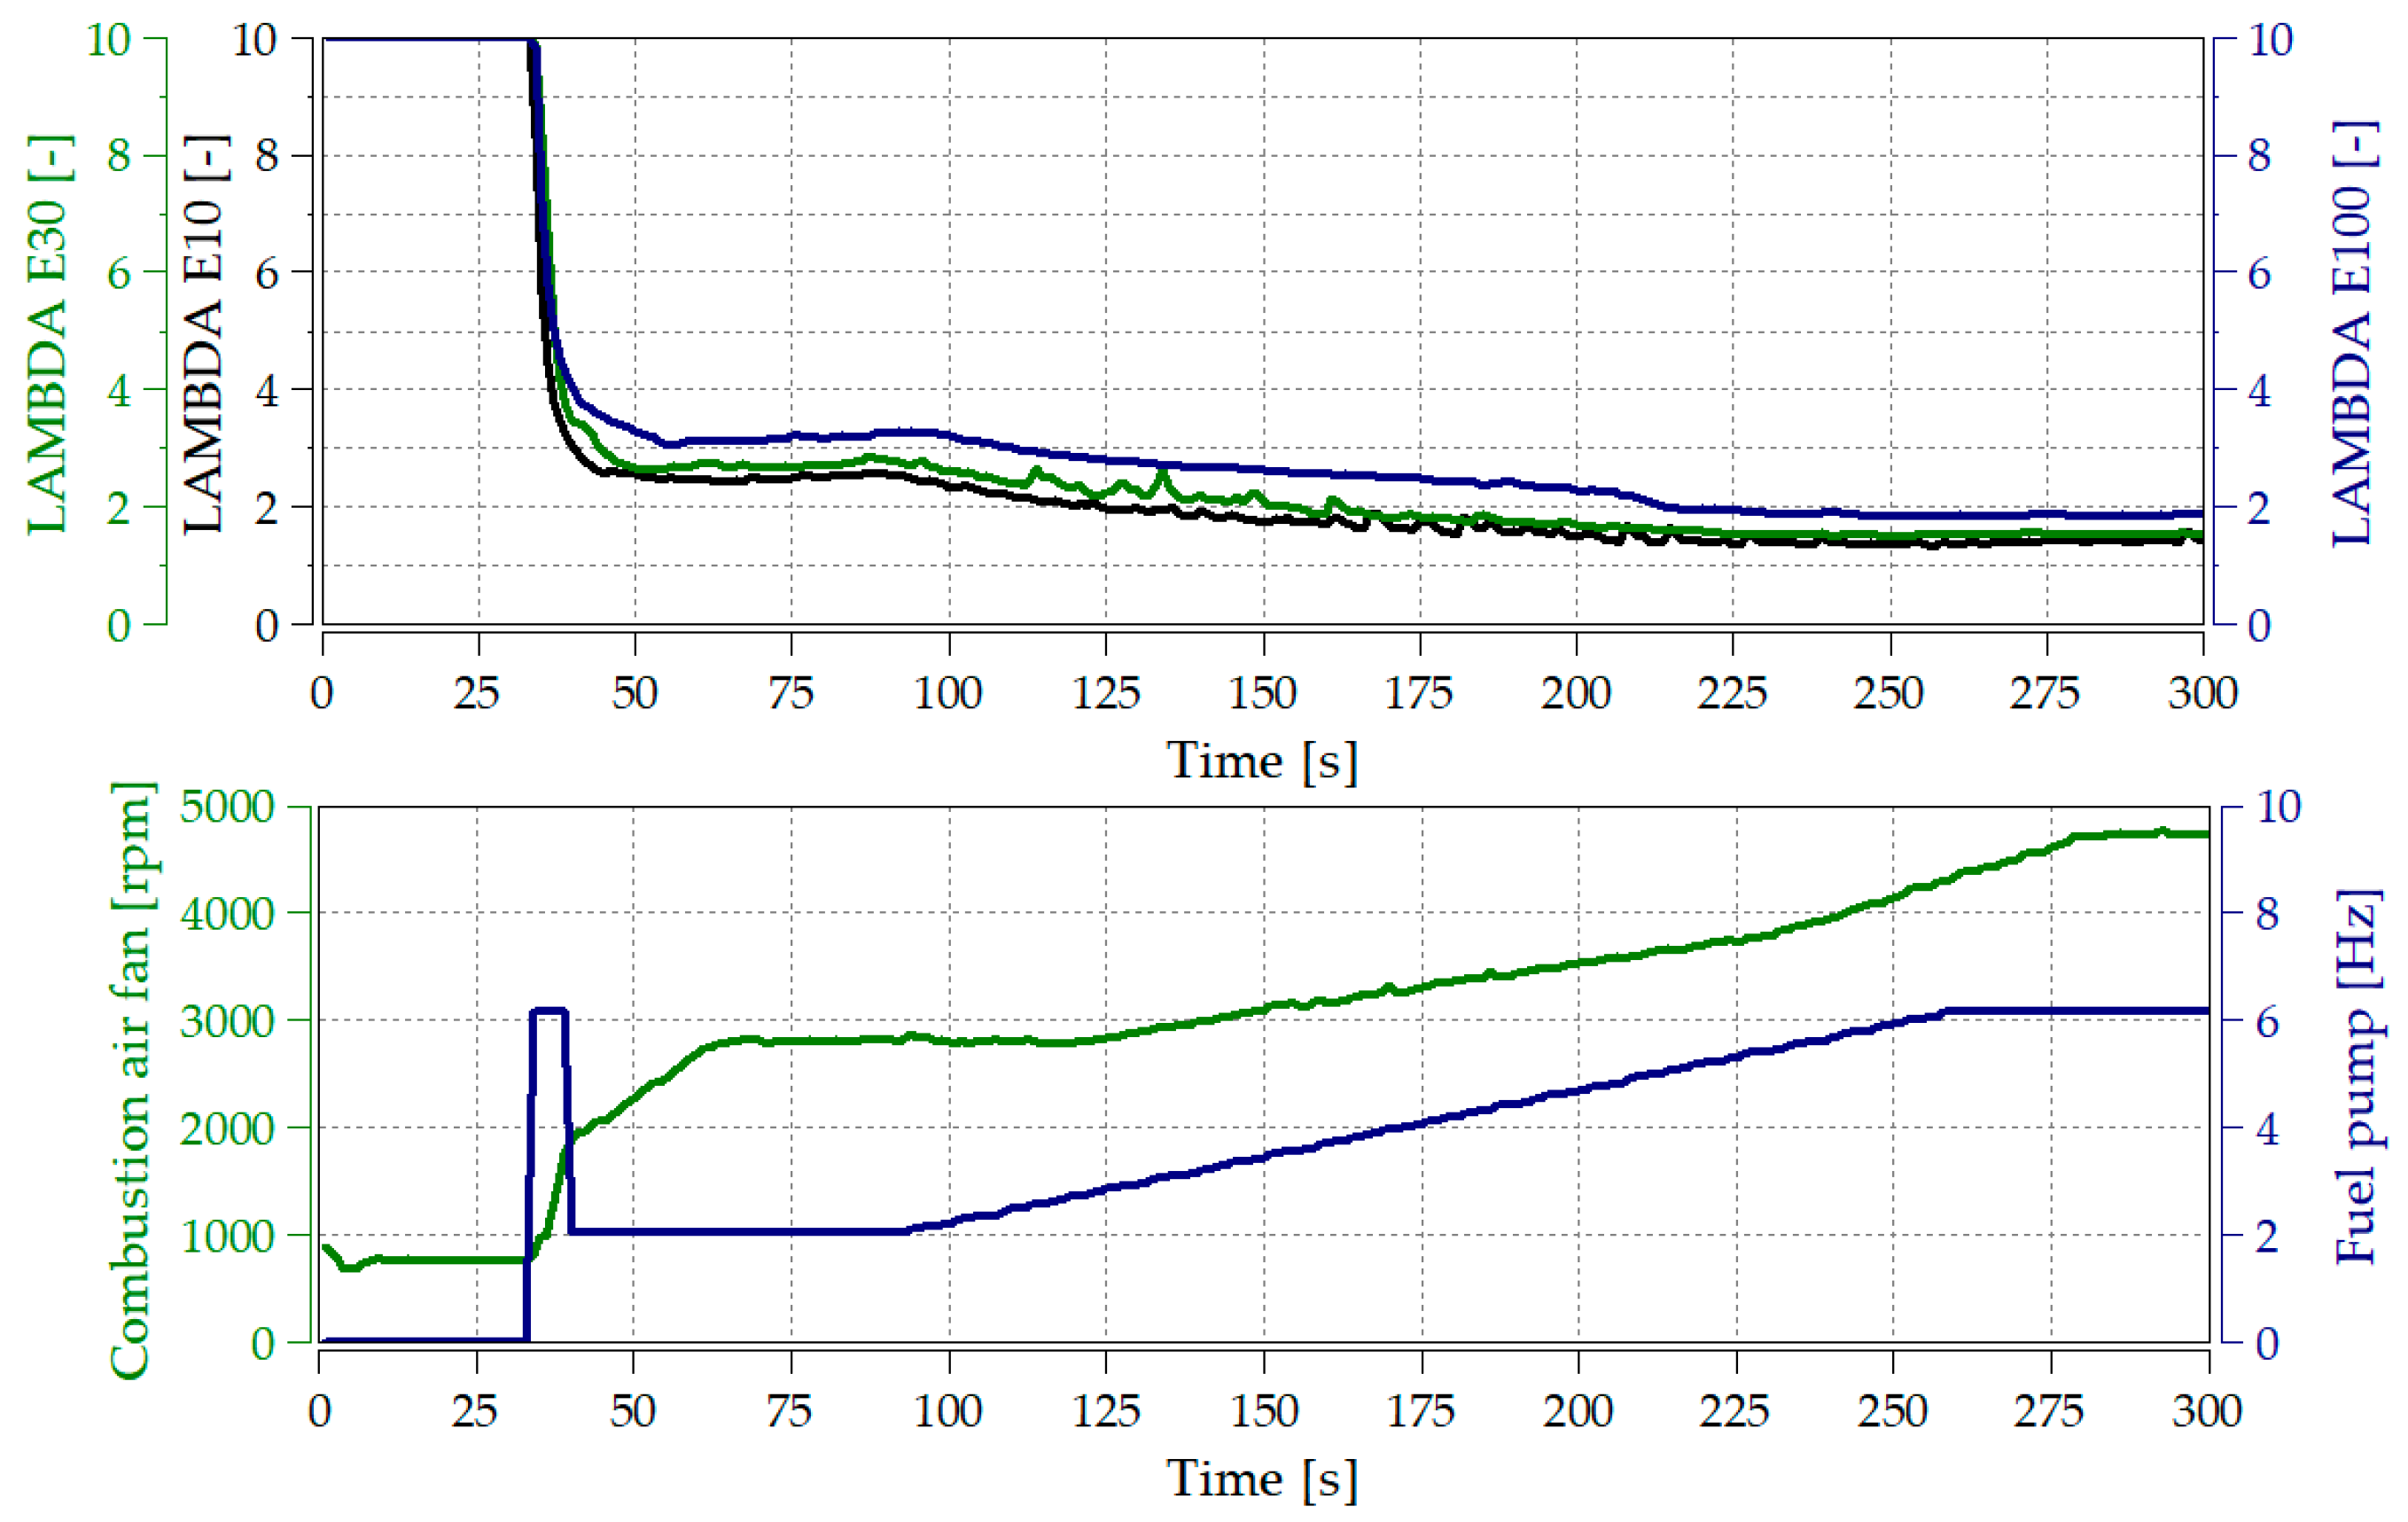
Figure 7.
The particle number concentration changes during the startup phase.
Figure 7.
The particle number concentration changes during the startup phase.
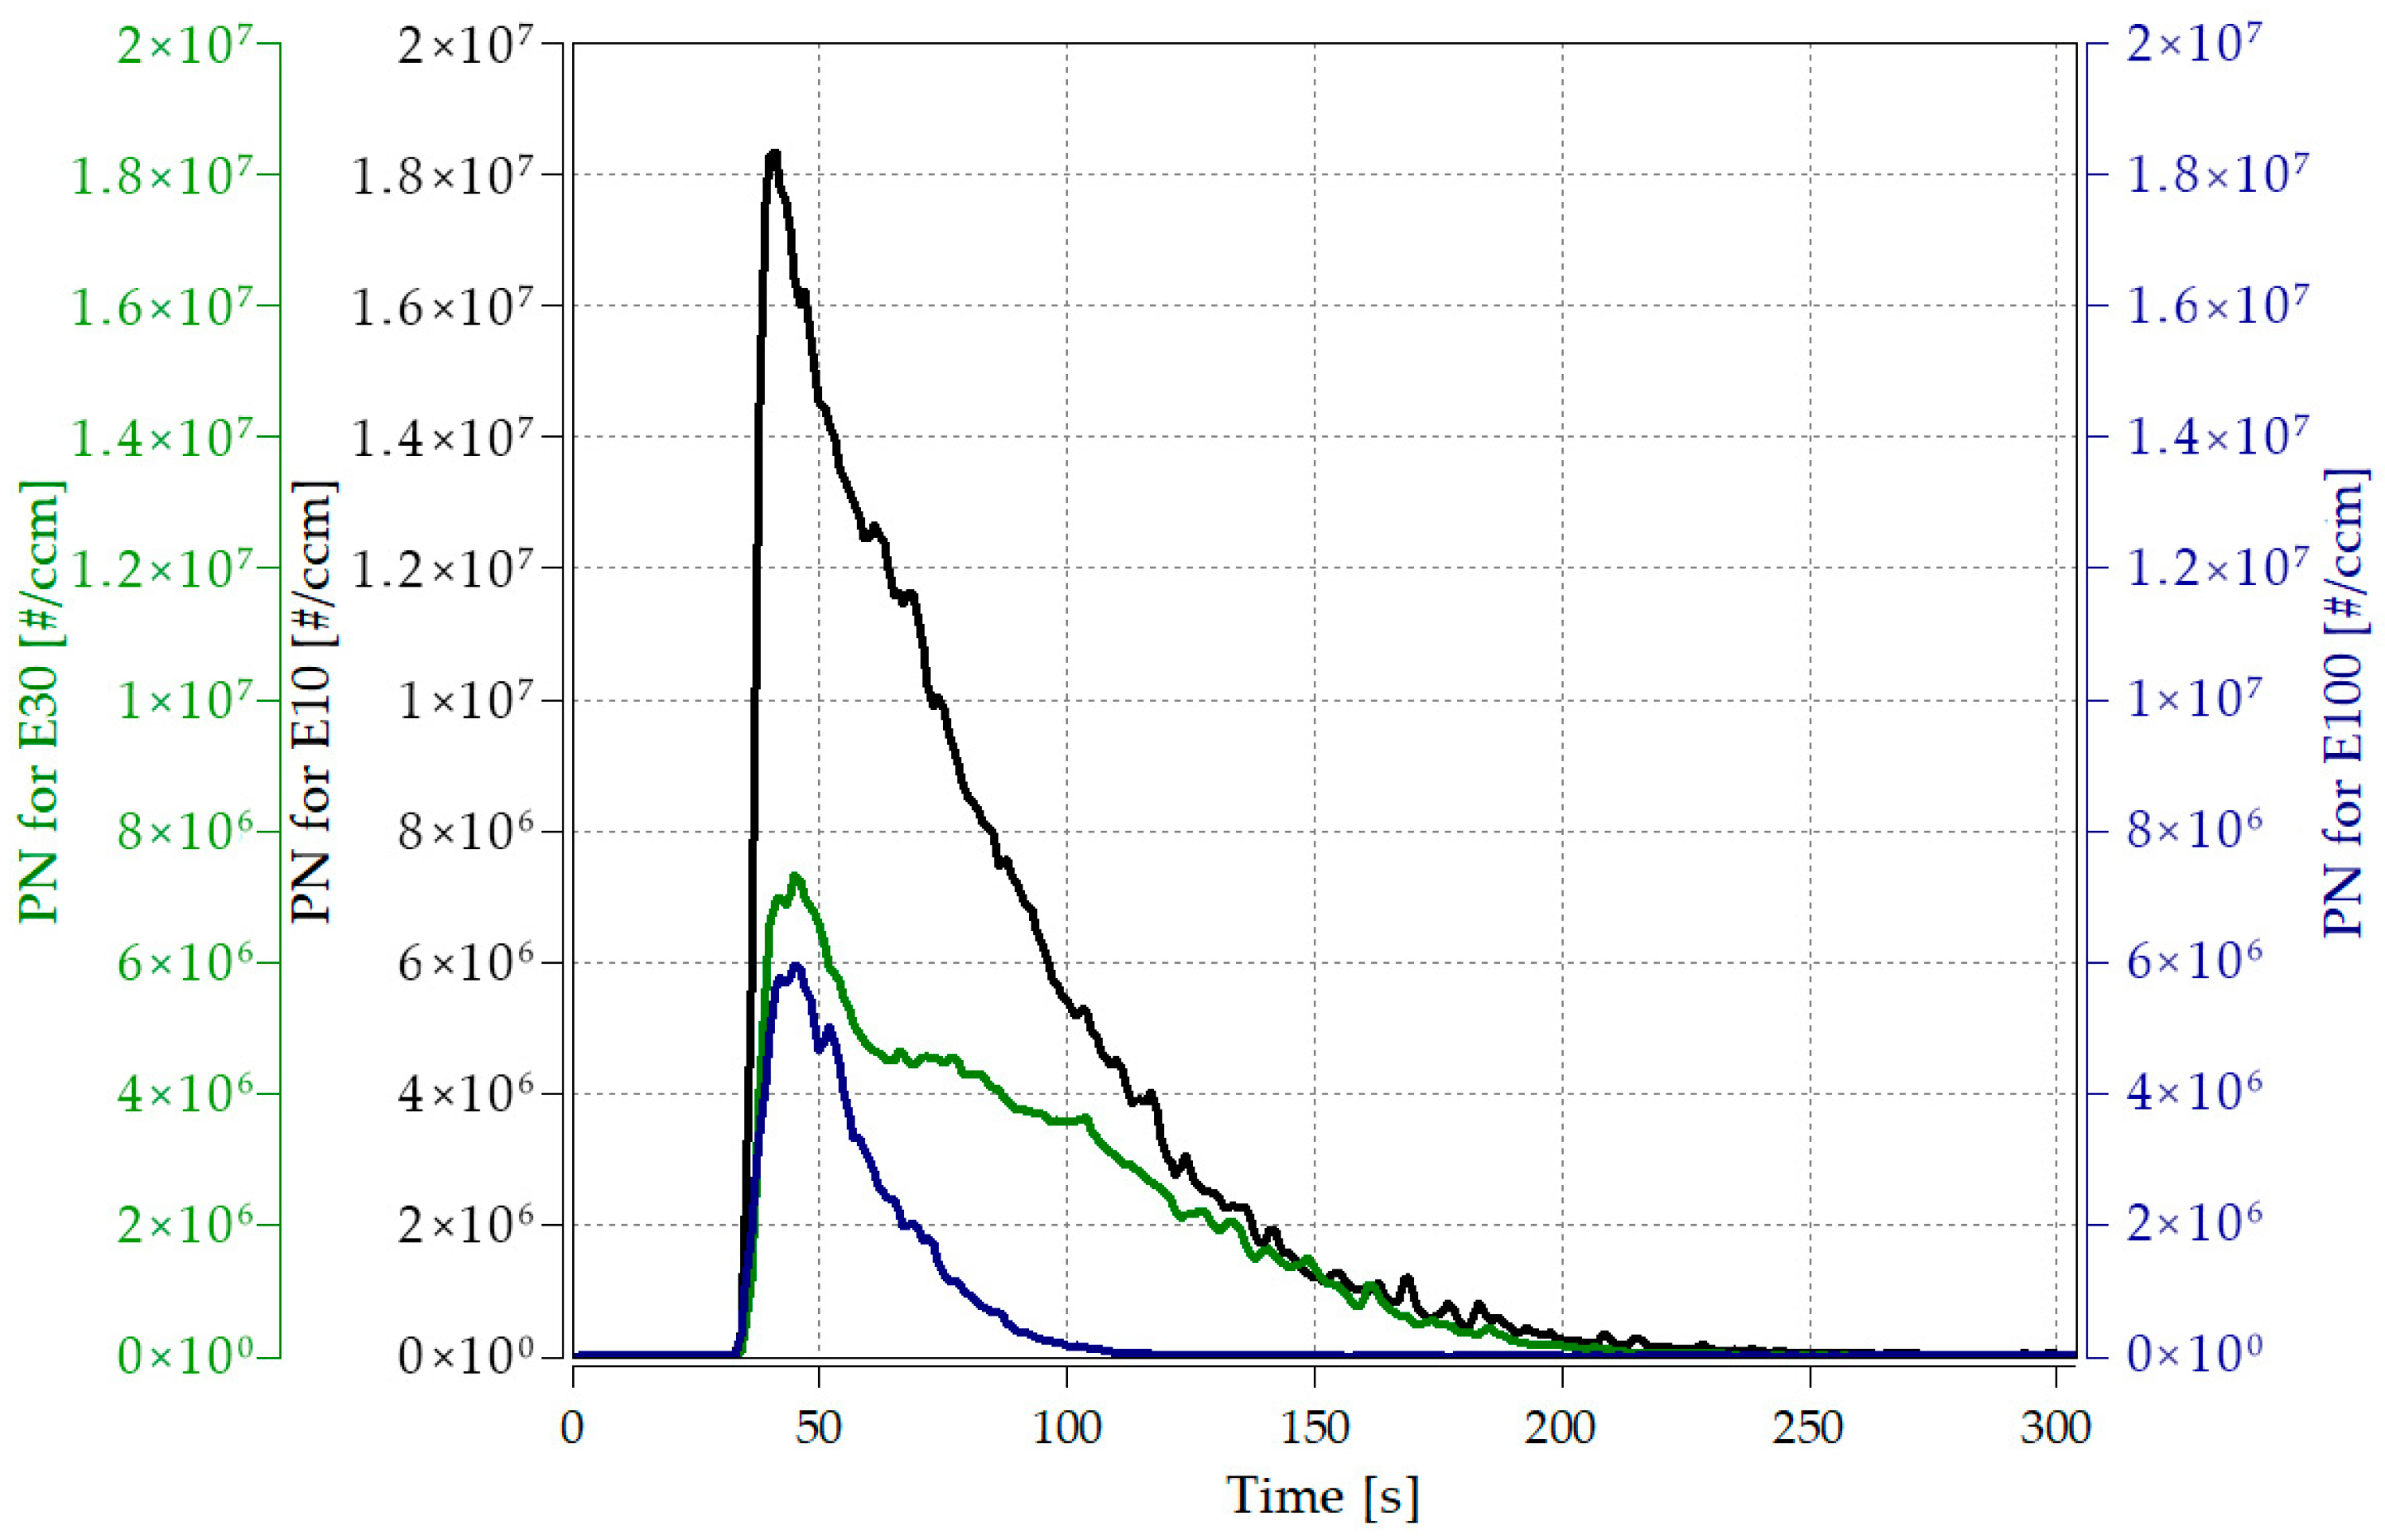
Figure 8.
Total particulate matter emissions from different fuels during the start-up phase.
Figure 8.
Total particulate matter emissions from different fuels during the start-up phase.
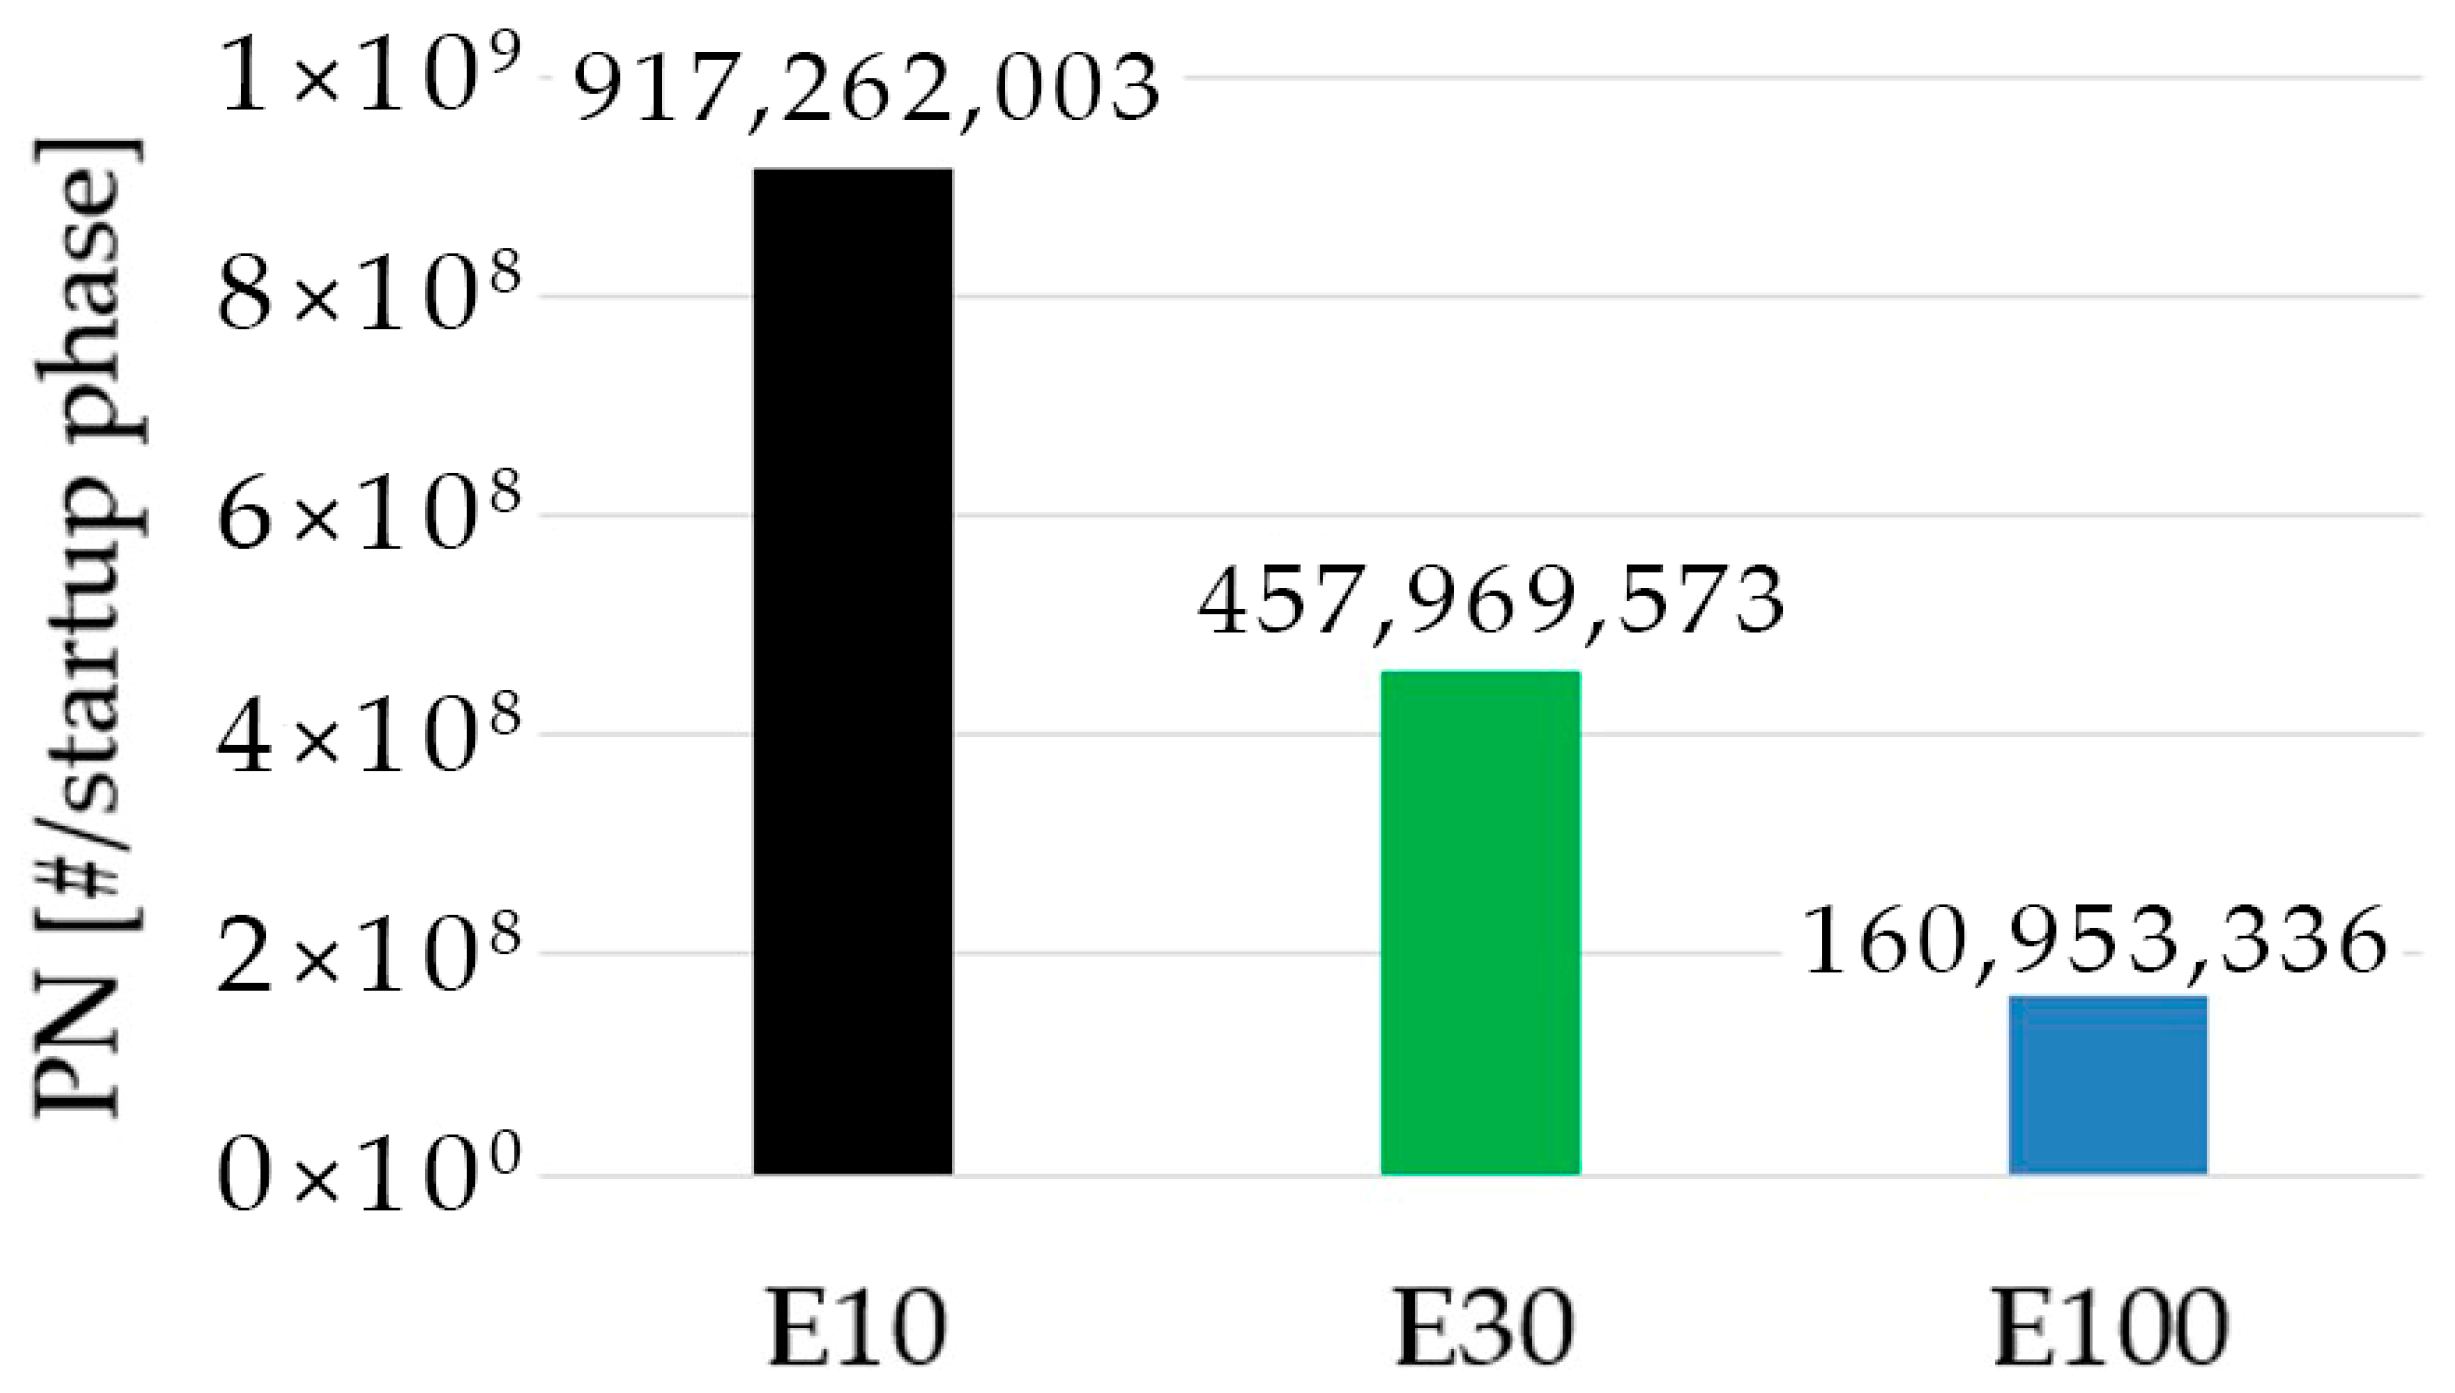
Figure 9.
Change in lambda value (upper part) as the ethanol content increases and the fuel pump and fan control signals (lower part) in the steady state phase.
Figure 9.
Change in lambda value (upper part) as the ethanol content increases and the fuel pump and fan control signals (lower part) in the steady state phase.
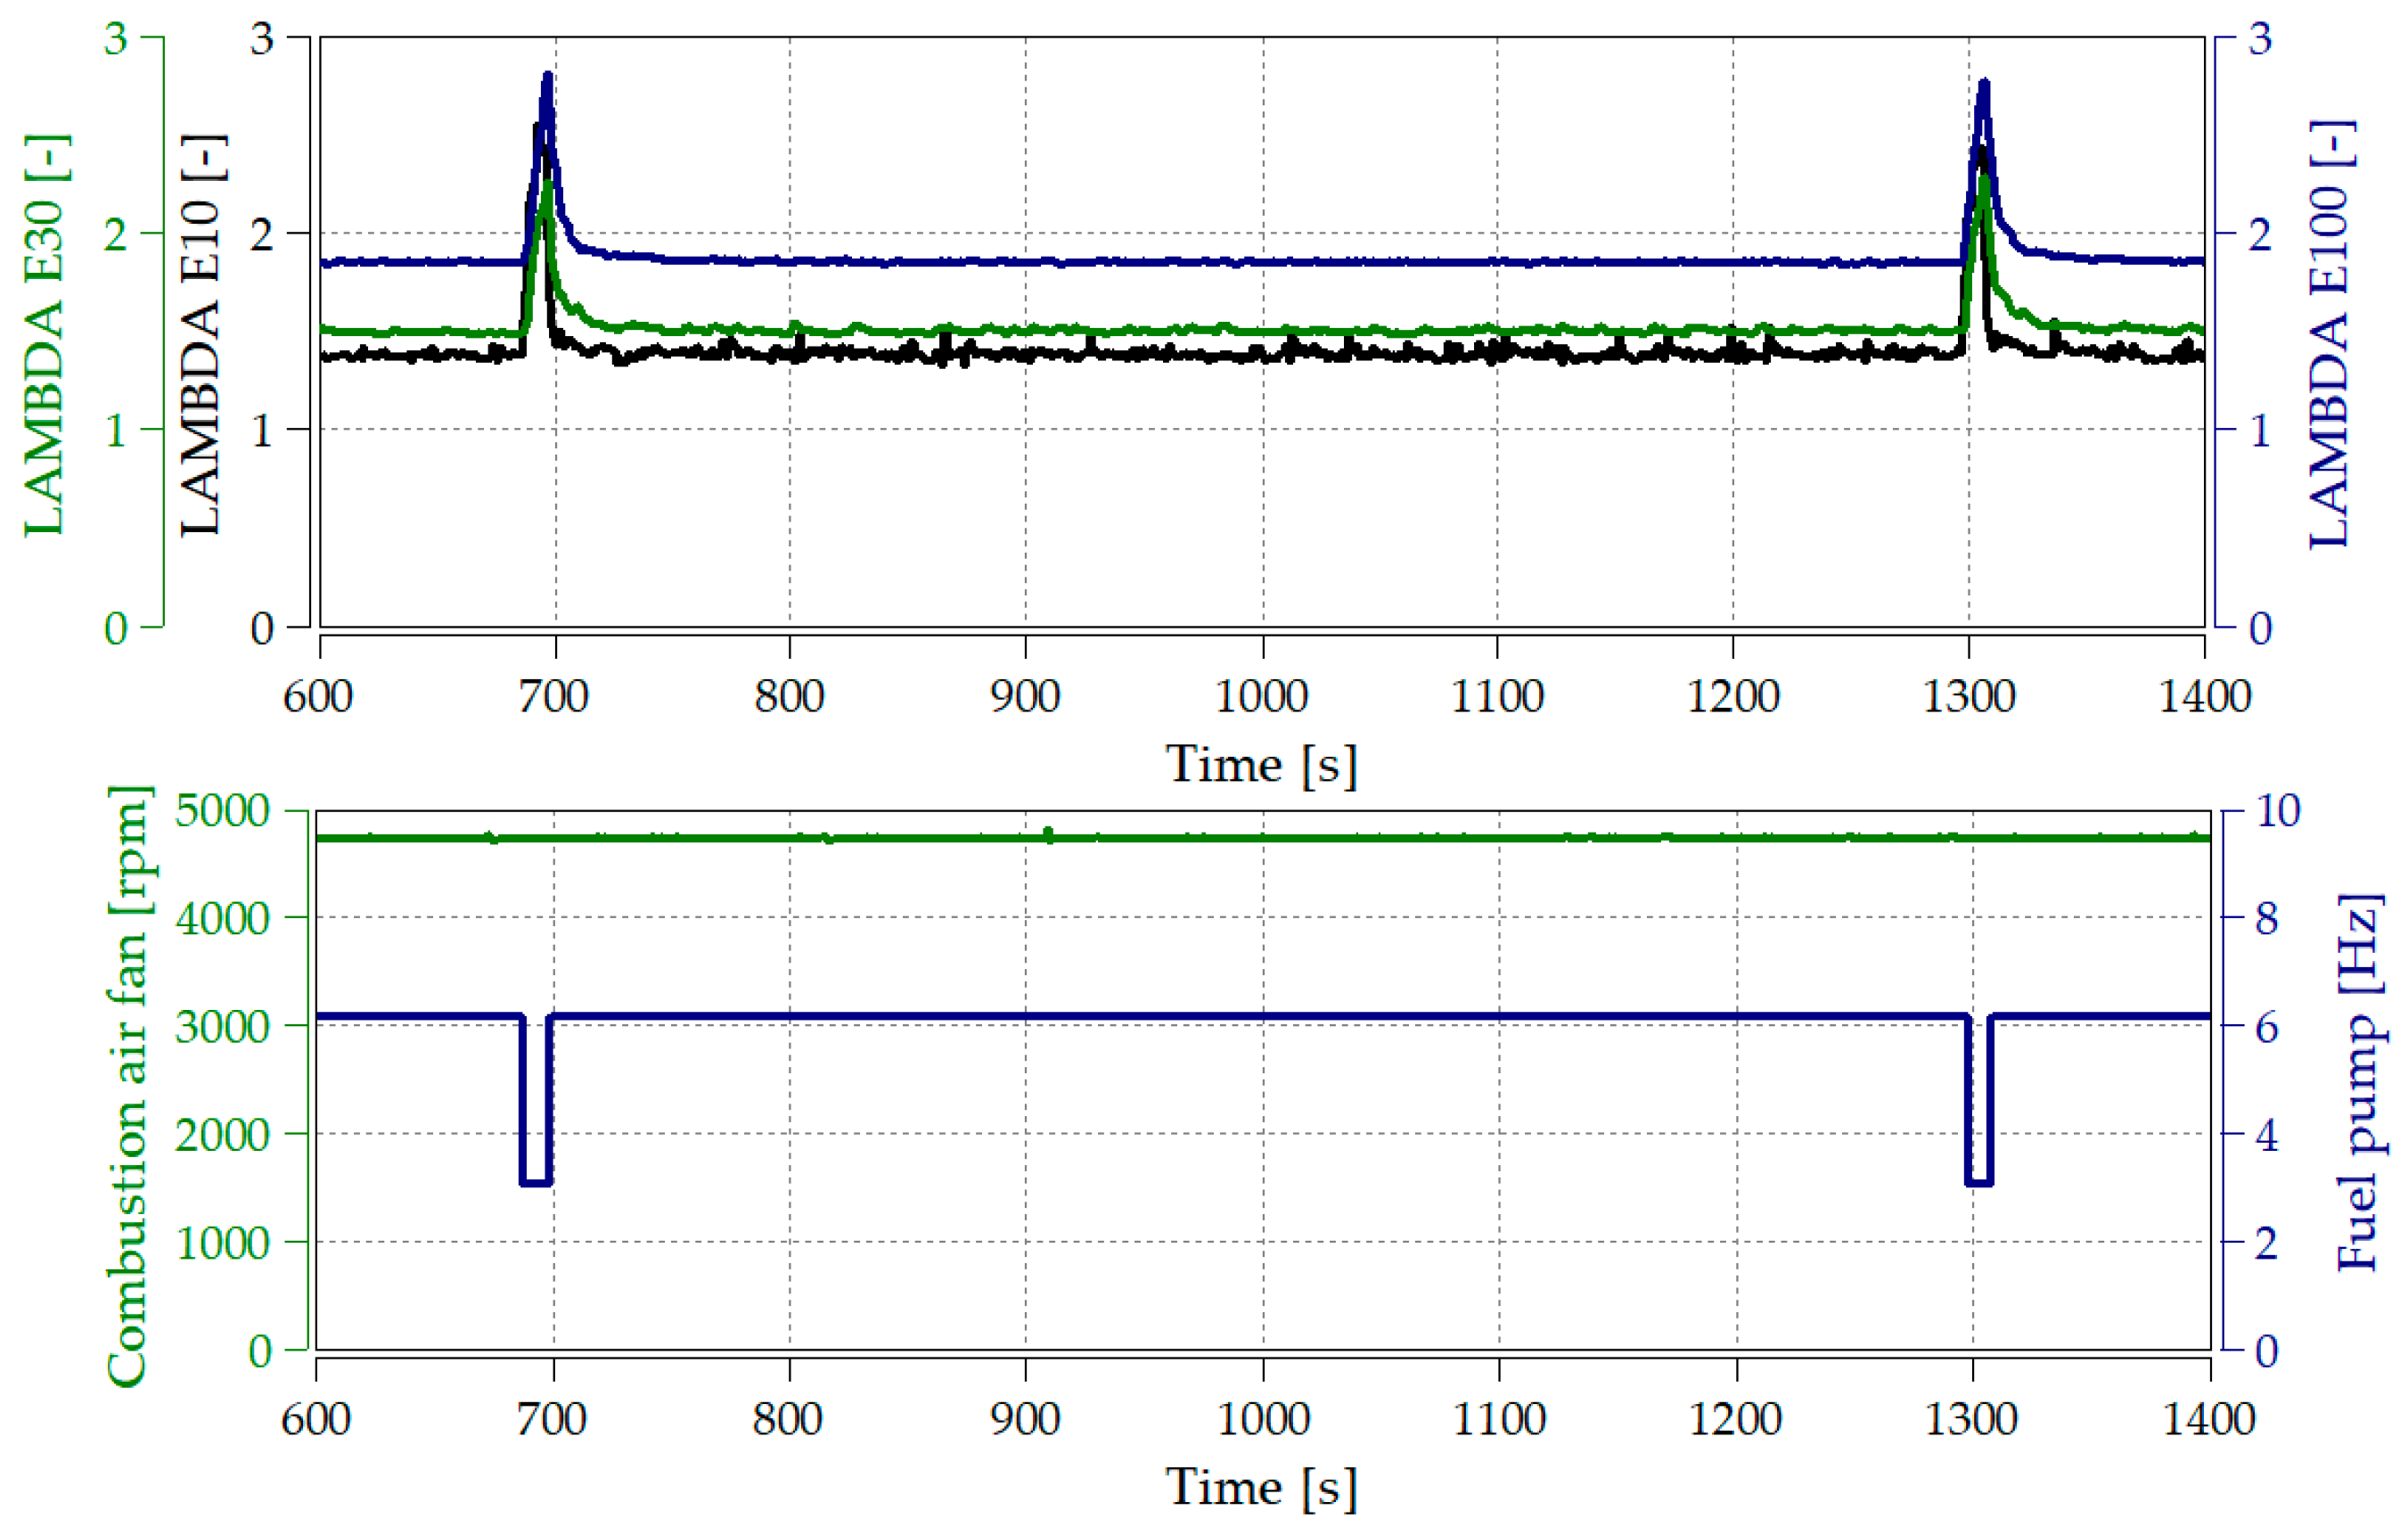
Figure 10.
The particle number concentration changes during the steady-state phase.
Figure 10.
The particle number concentration changes during the steady-state phase.
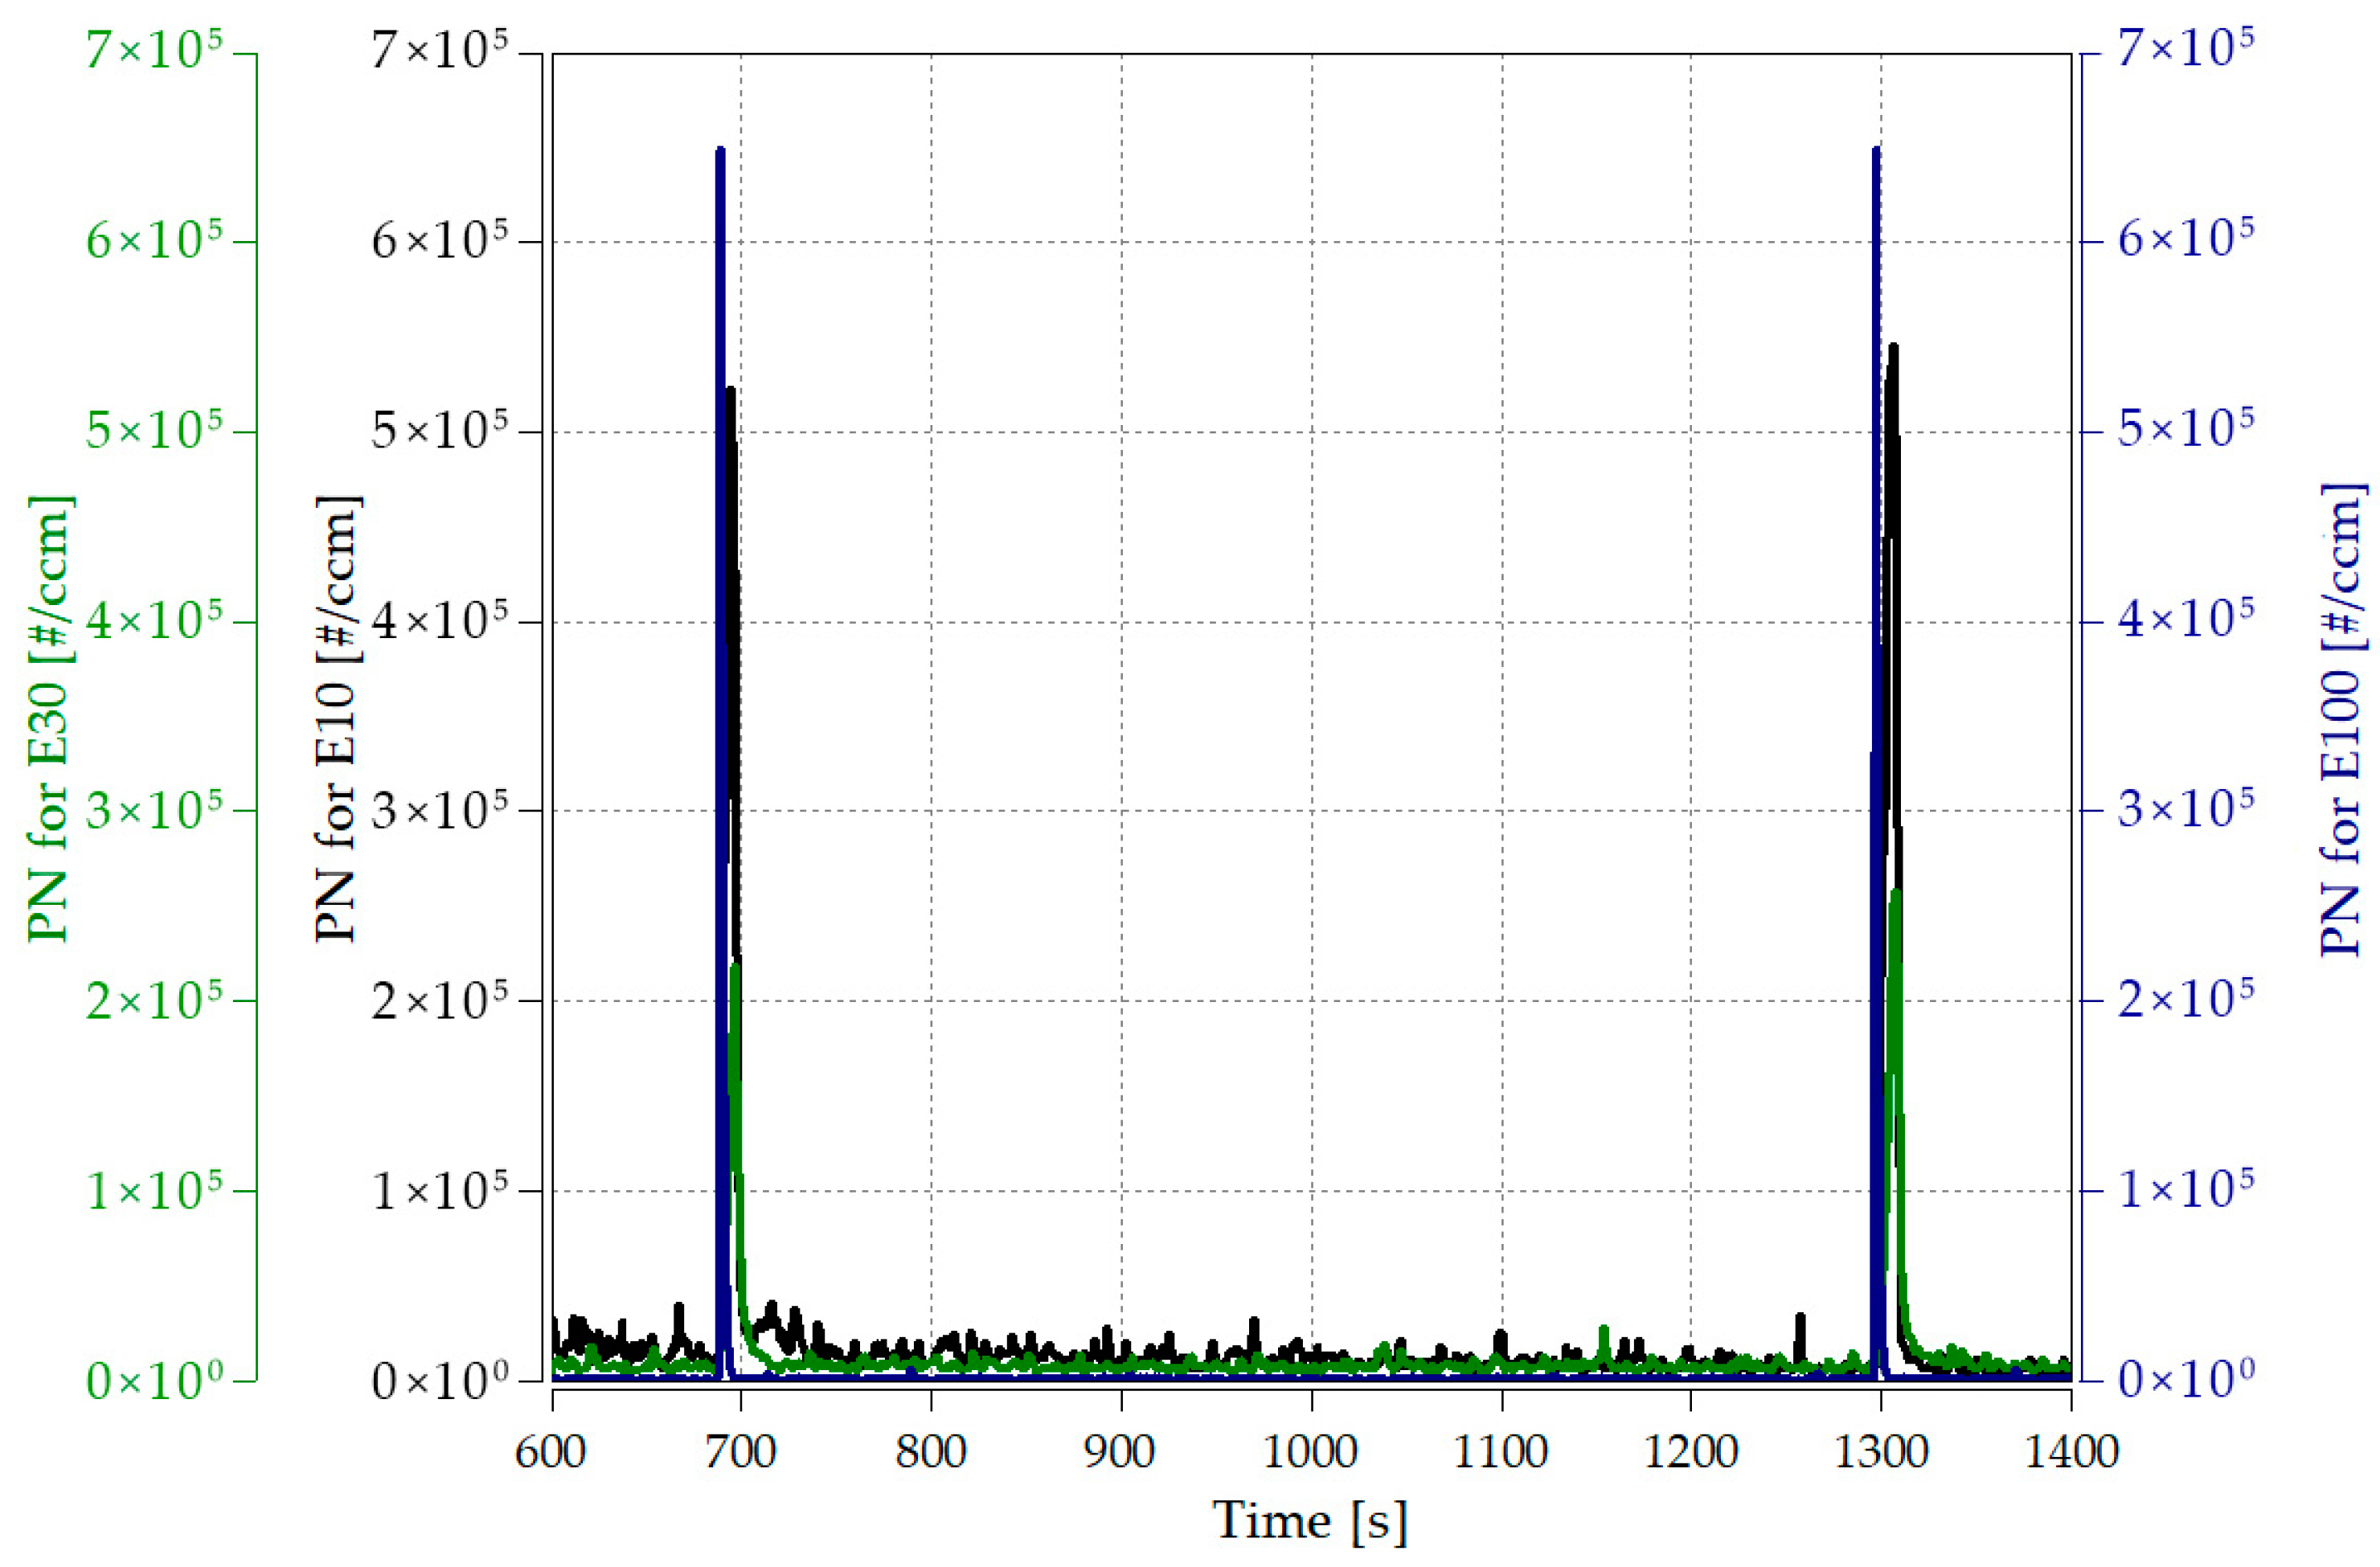
Figure 11.
Total particulate emissions during the steady state phase for different fuels.
Figure 11.
Total particulate emissions during the steady state phase for different fuels.
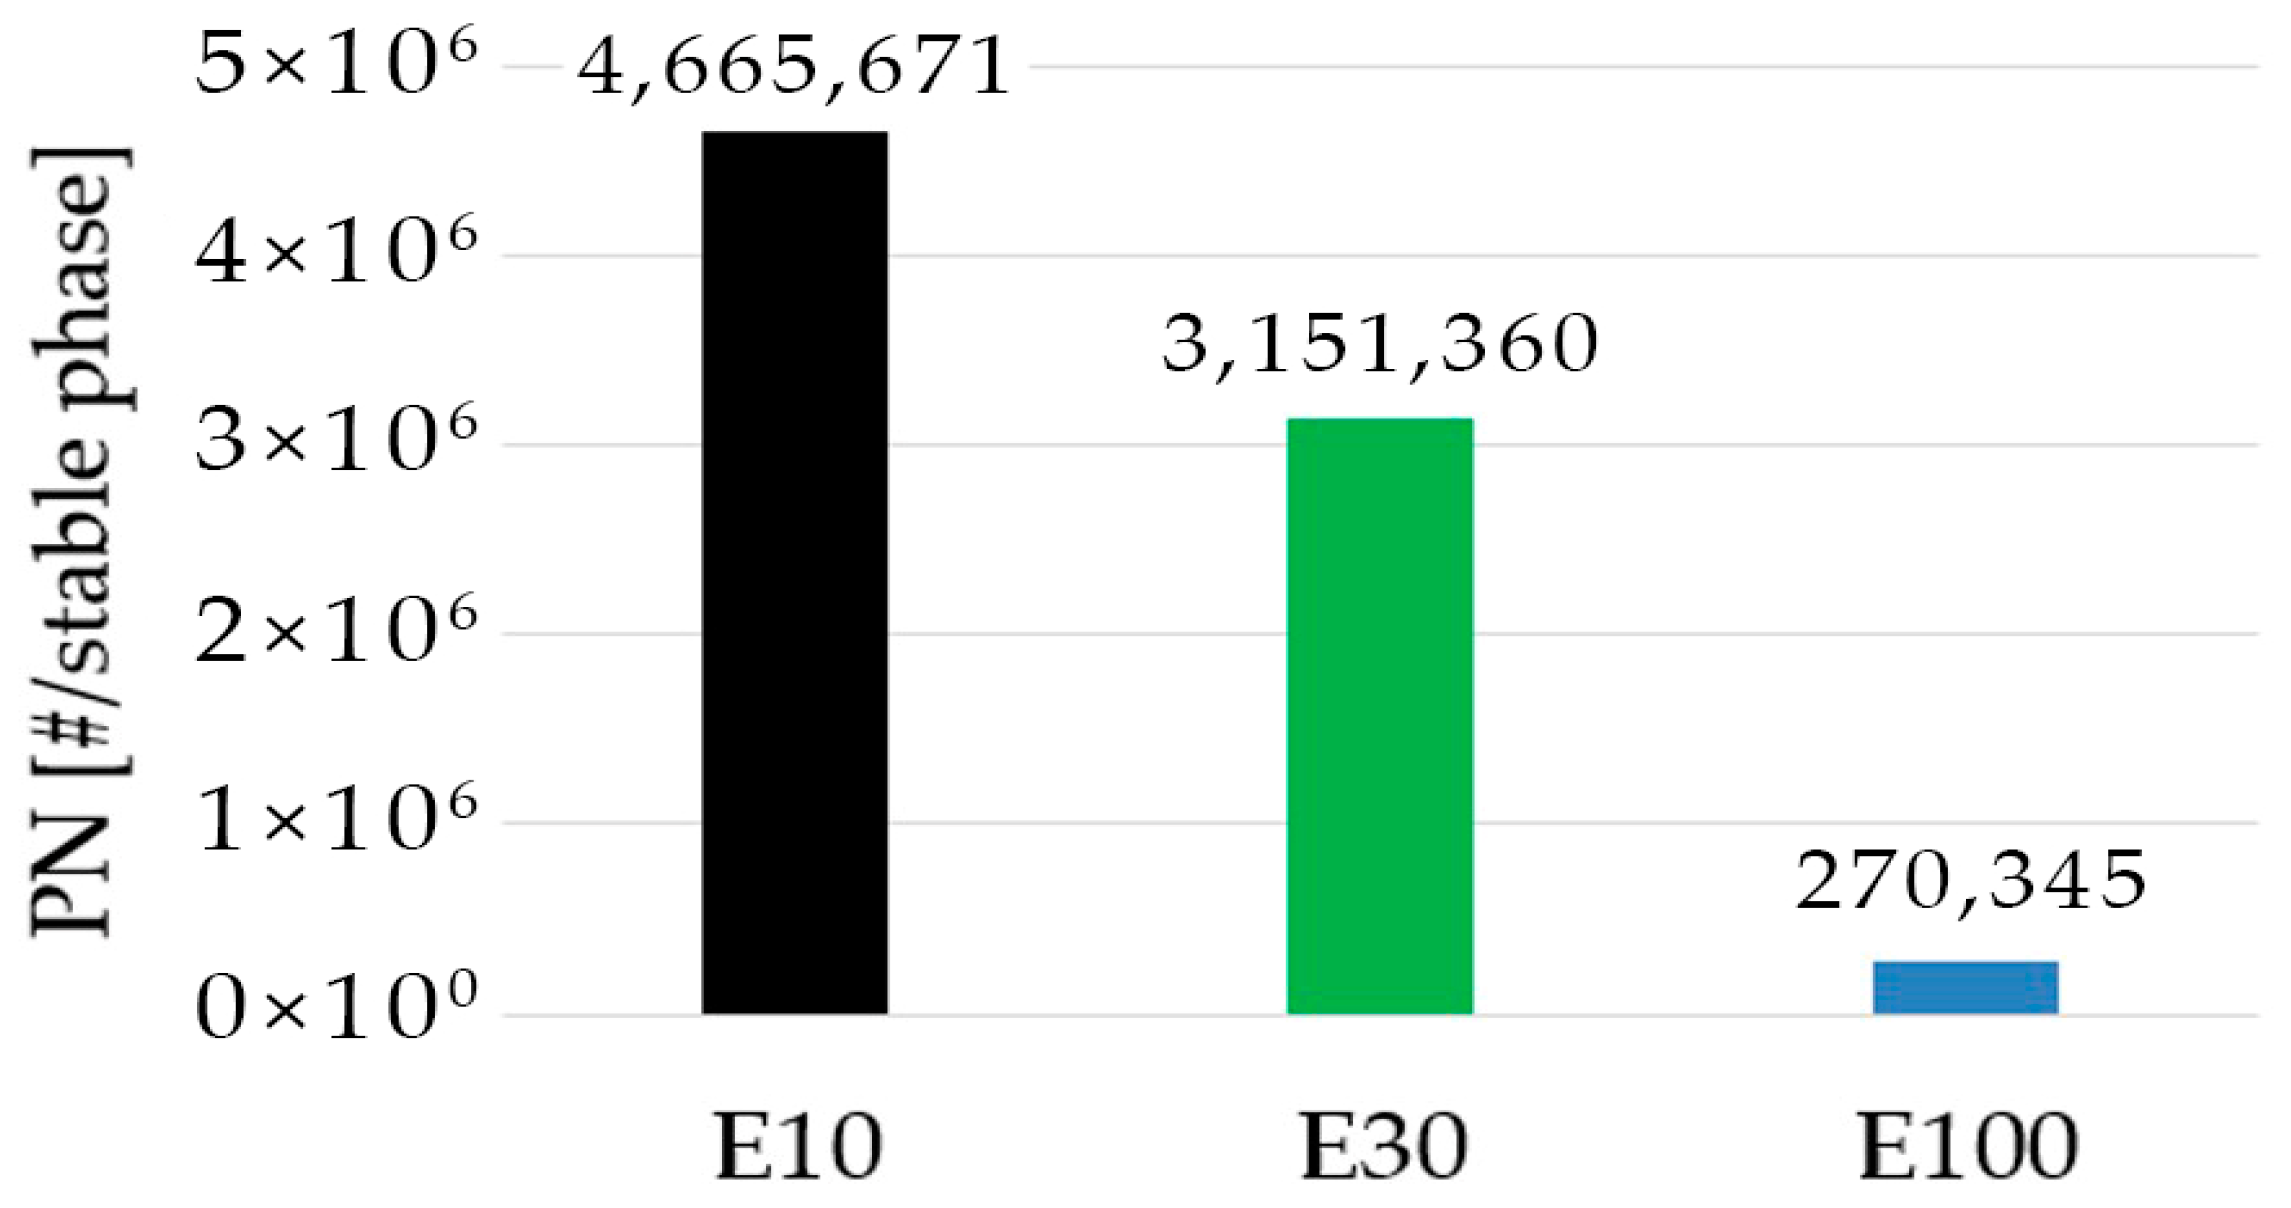
Figure 12.
Change in lambda value (upper part) as the ethanol content increases and the fuel pump and fan control signals (lower part) in the burnout stage.
Figure 12.
Change in lambda value (upper part) as the ethanol content increases and the fuel pump and fan control signals (lower part) in the burnout stage.
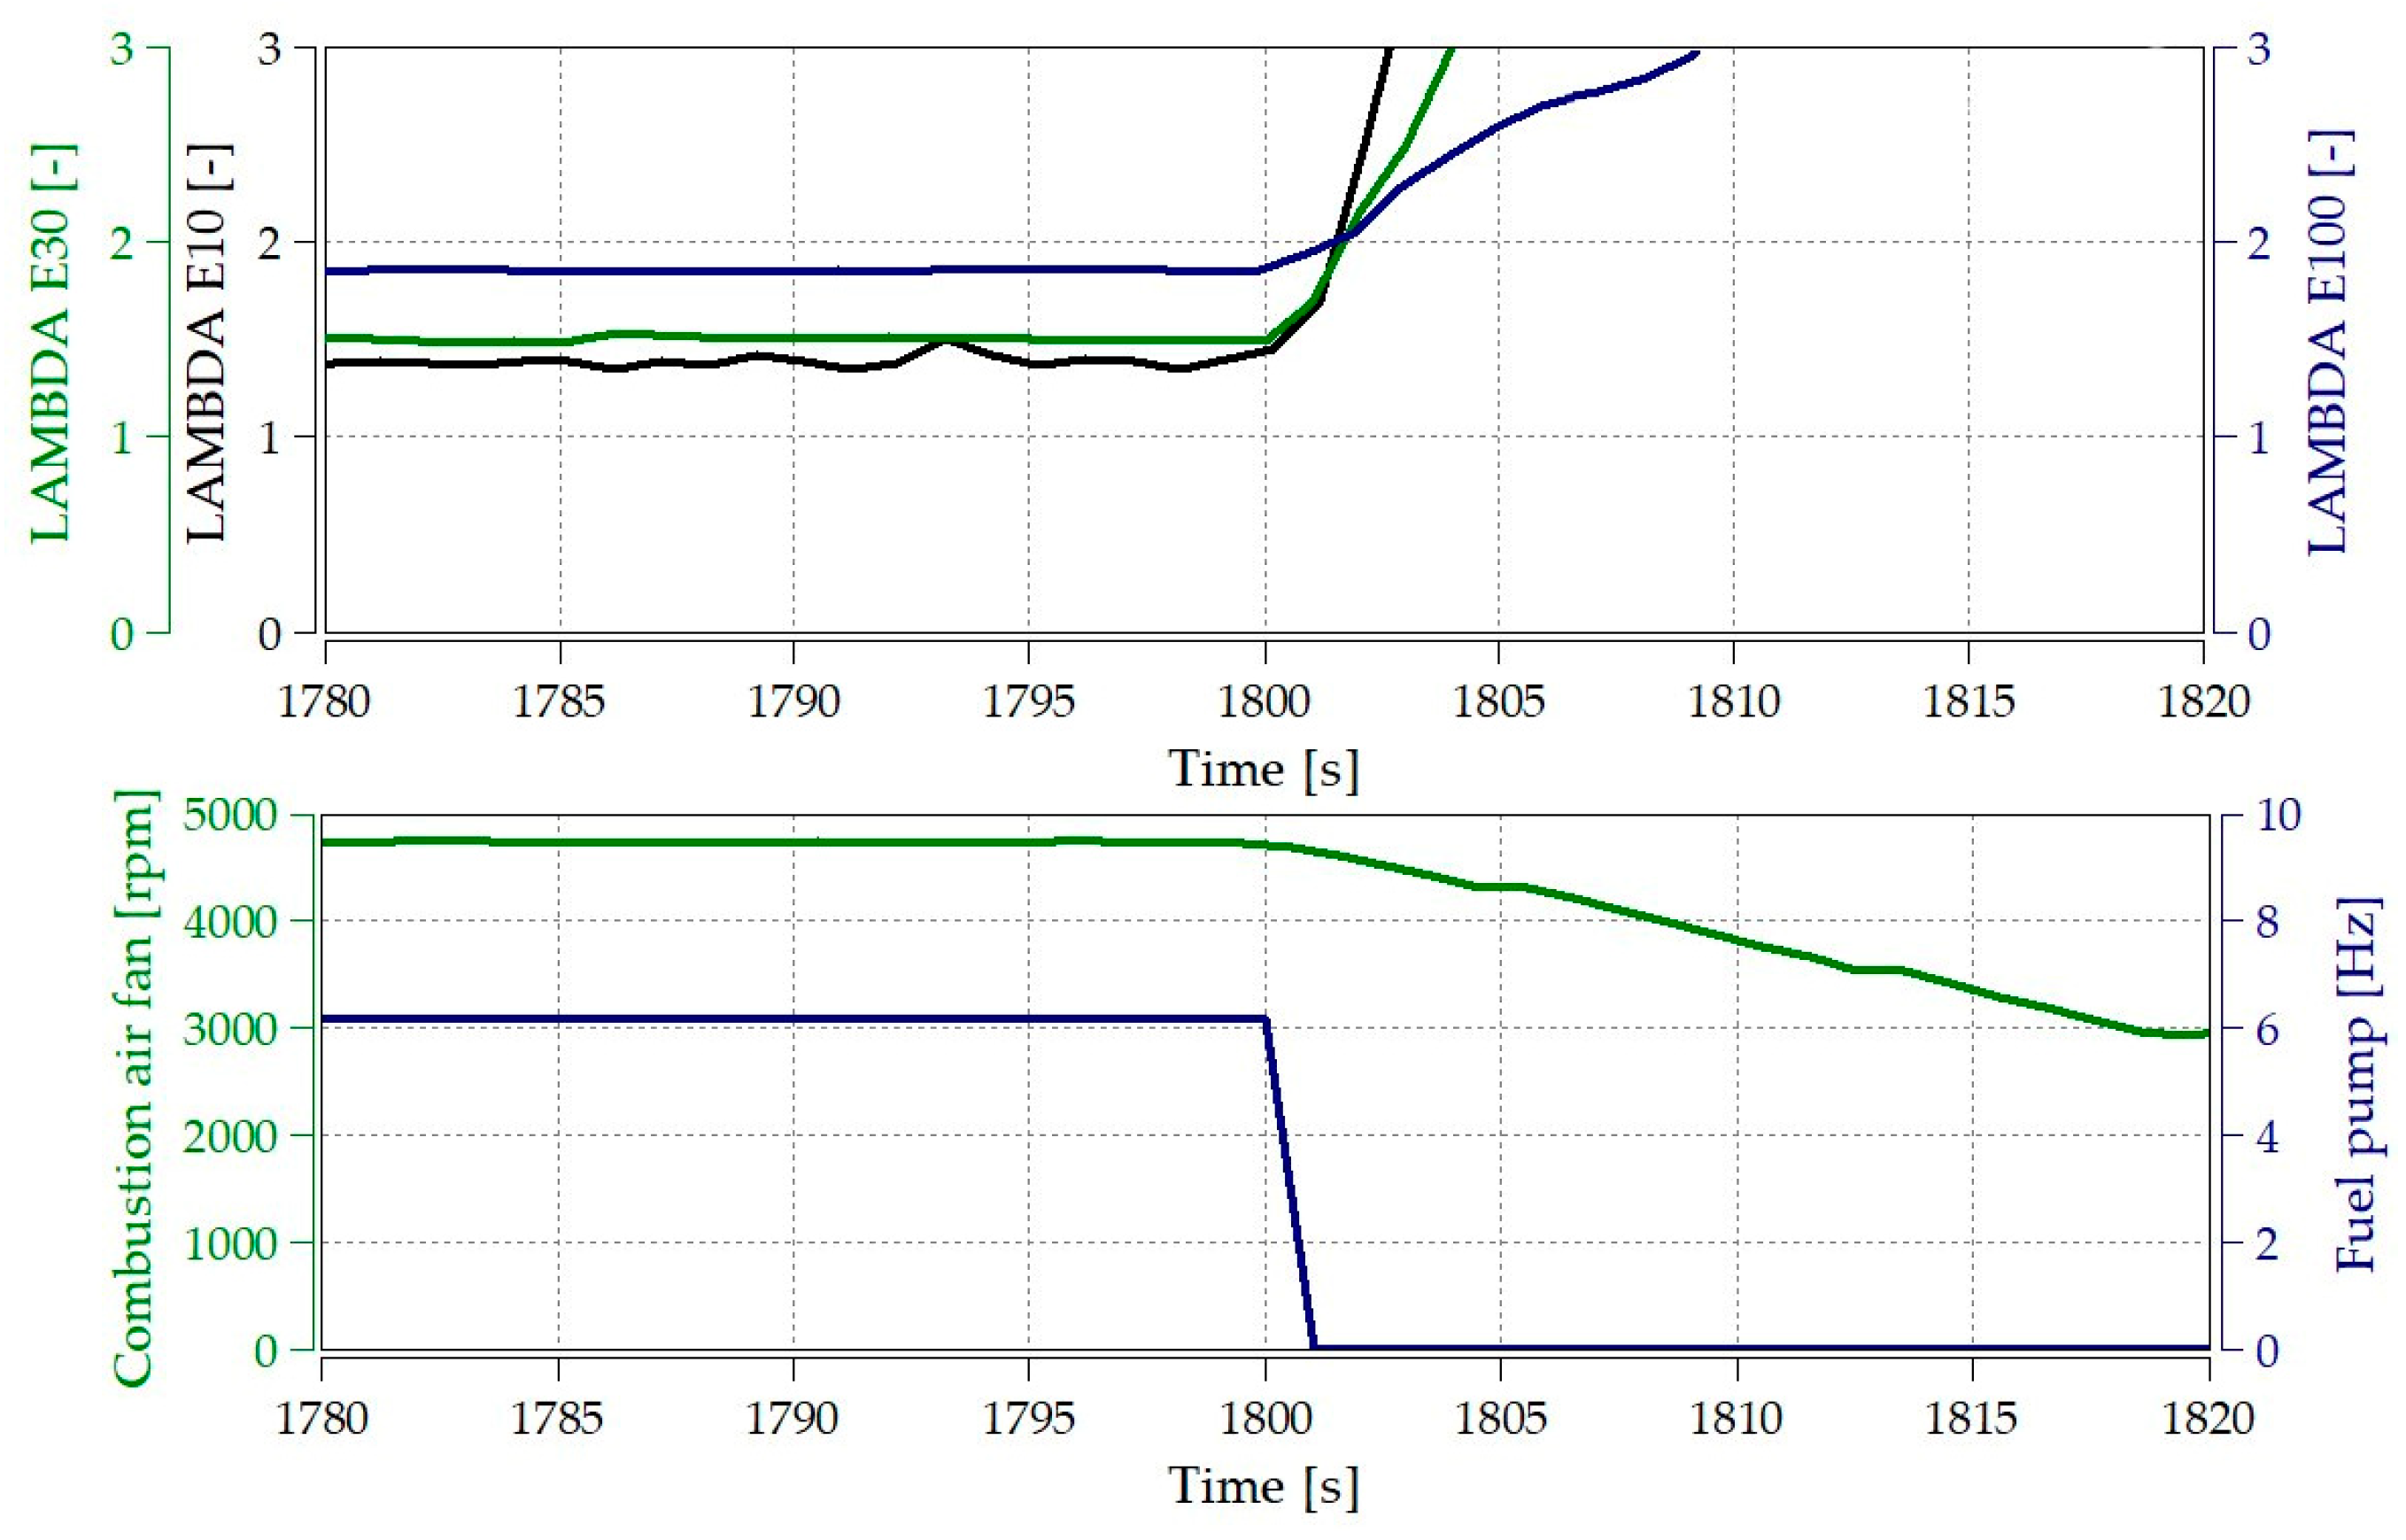
Figure 13.
Particle number concentration changes during the burnout phase.
Figure 13.
Particle number concentration changes during the burnout phase.
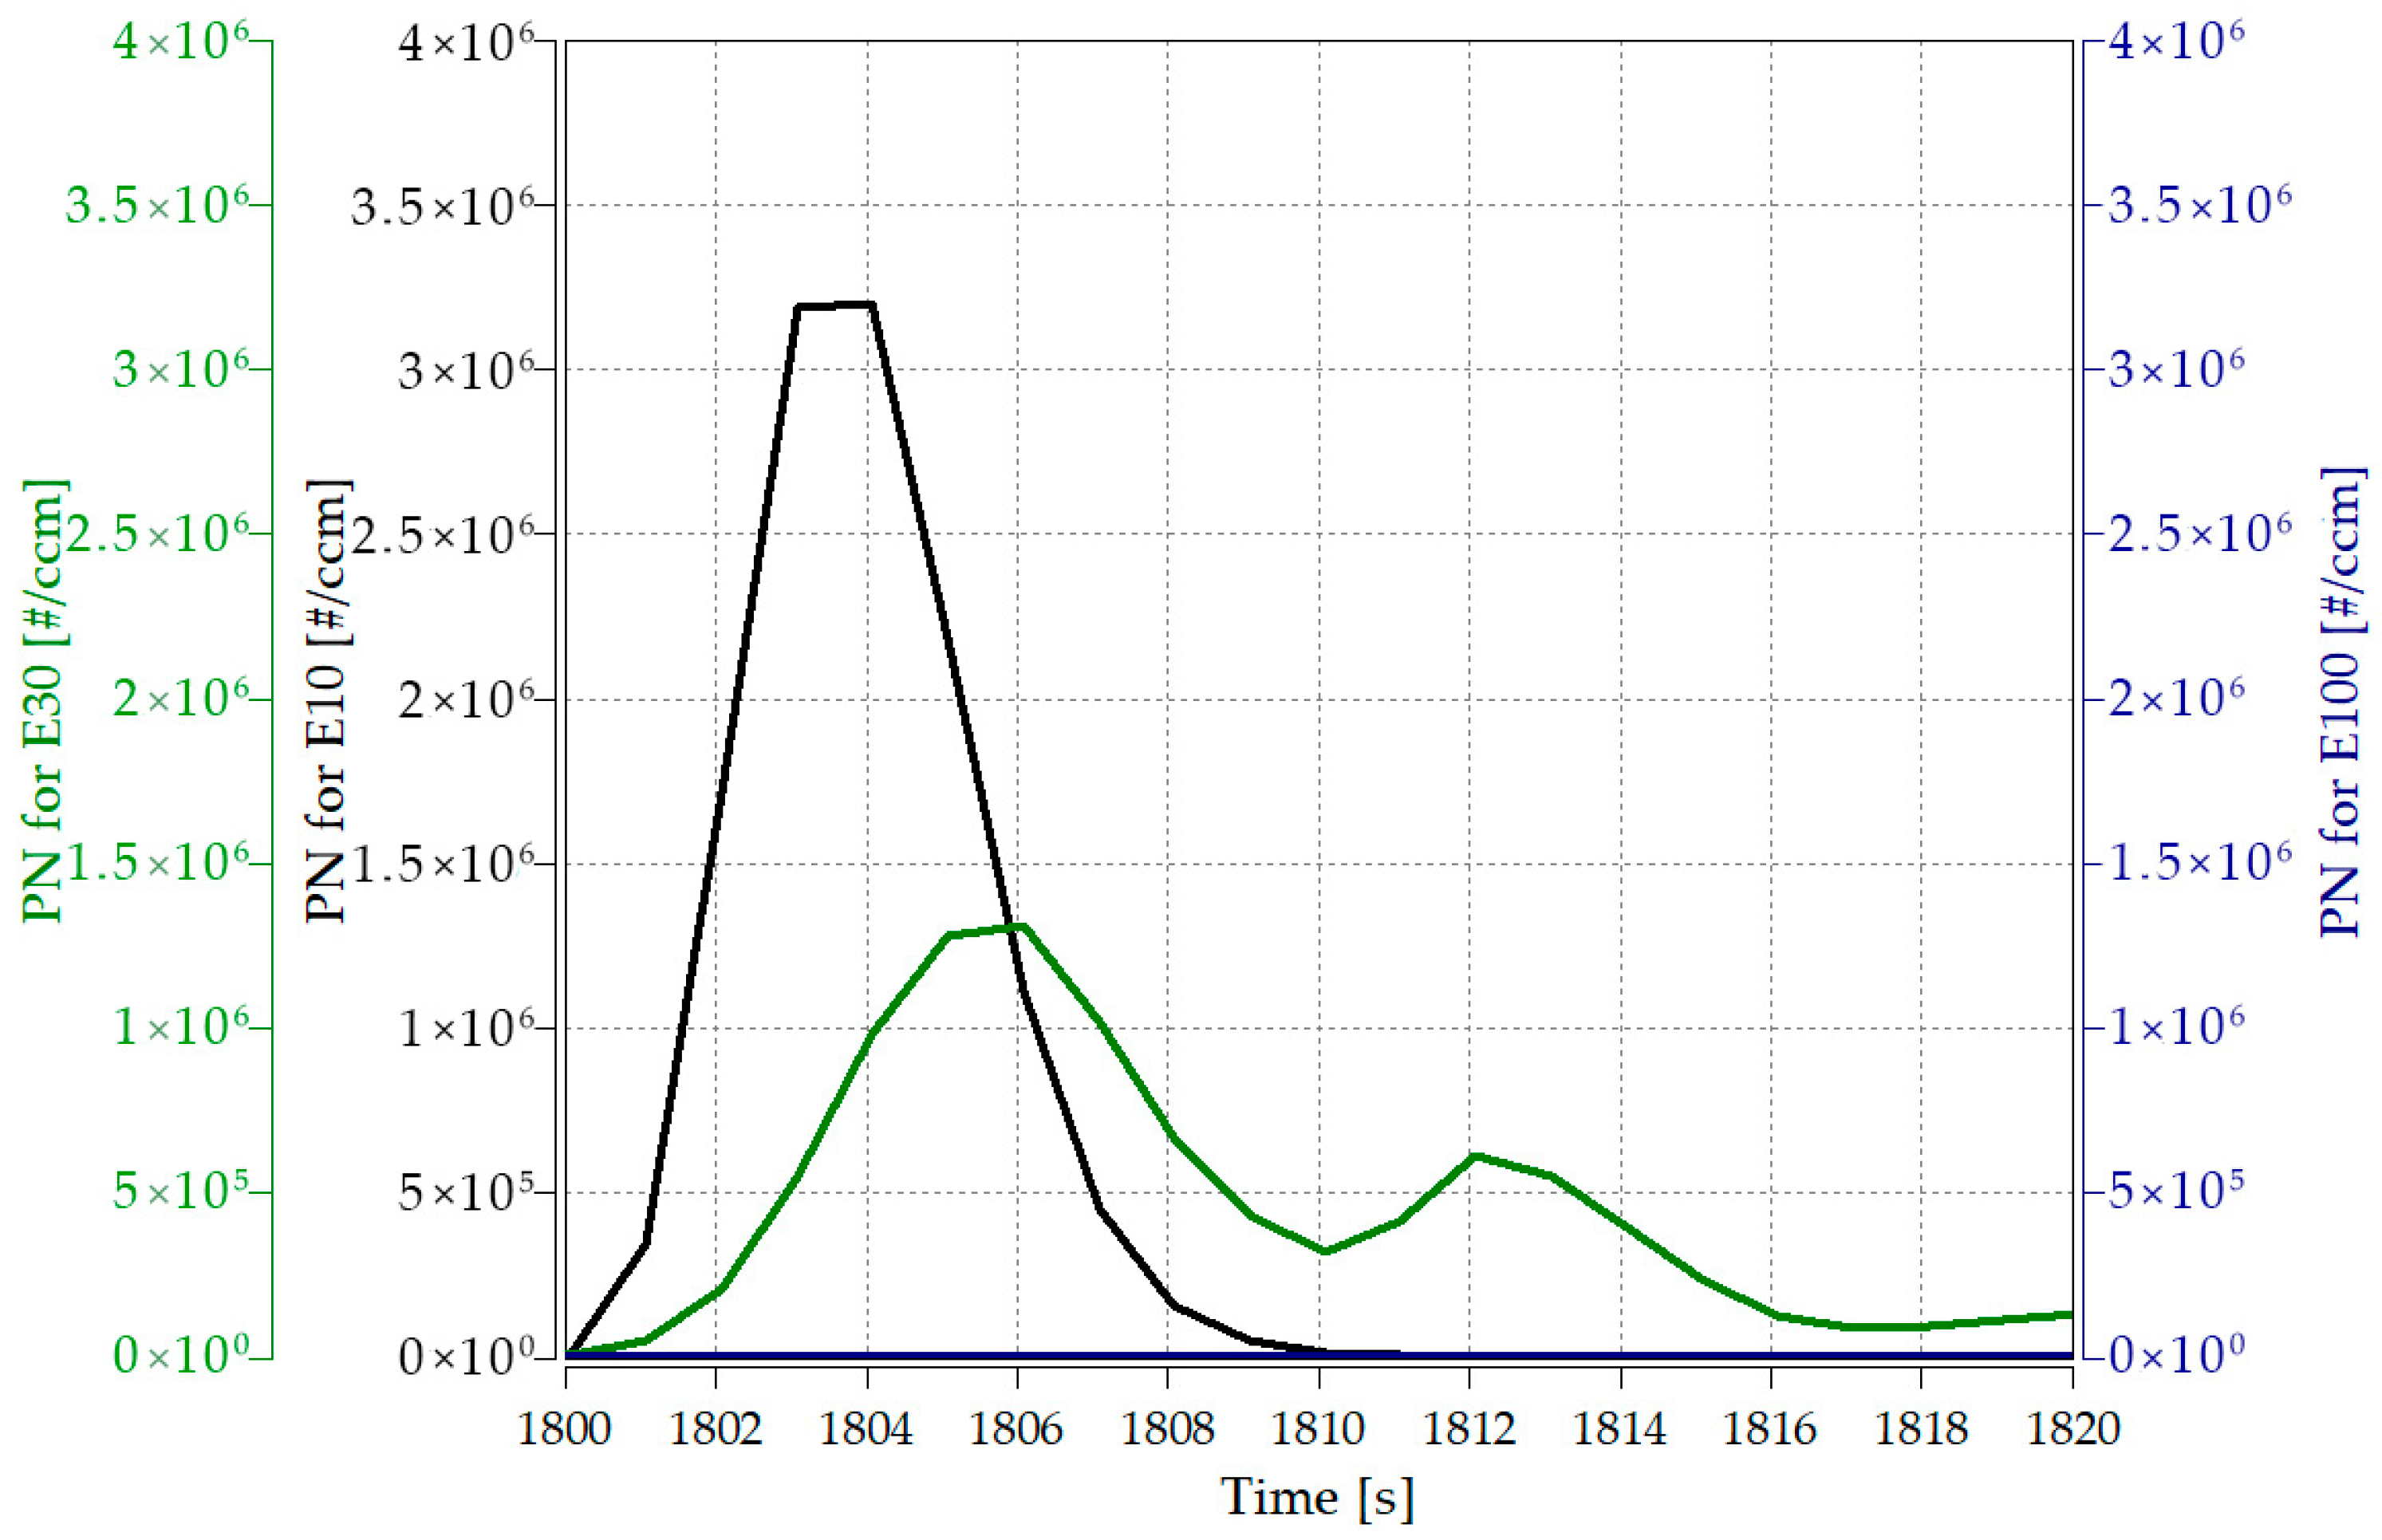
Figure 14.
The total amount of particulate matter emissions during the burnout stage of different fuels.
Figure 14.
The total amount of particulate matter emissions during the burnout stage of different fuels.
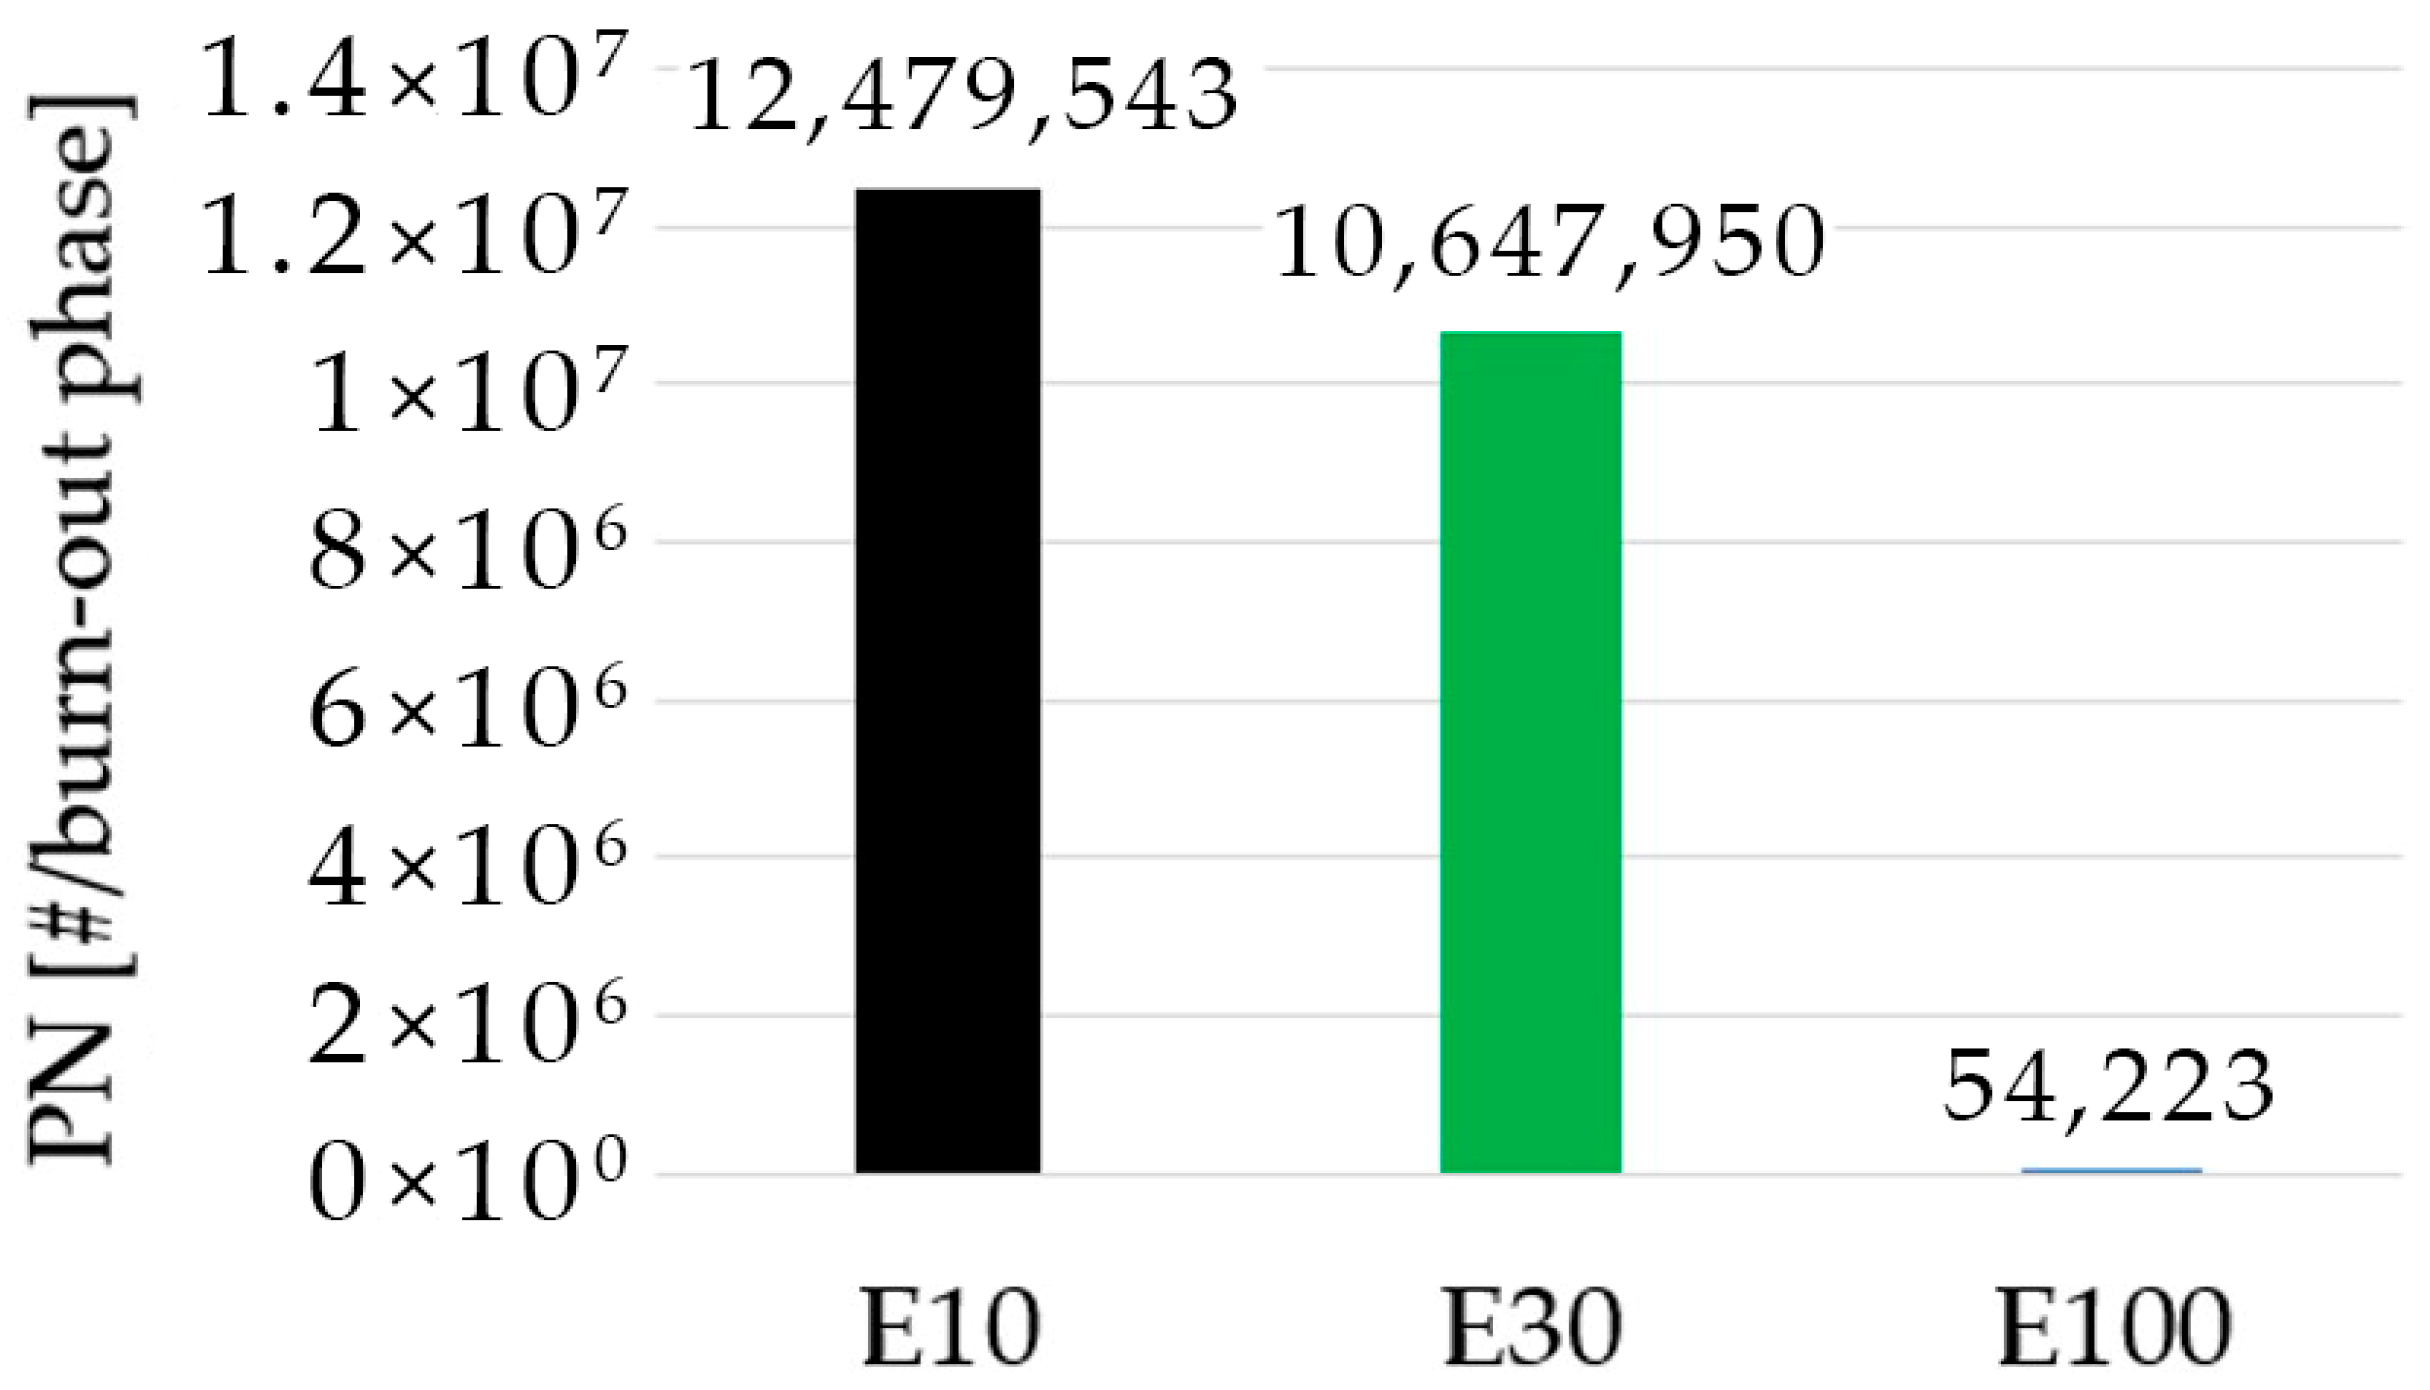
Figure 15.
Changes in particle number concentration of E10 and B7 during the startup phase.
Figure 15.
Changes in particle number concentration of E10 and B7 during the startup phase.
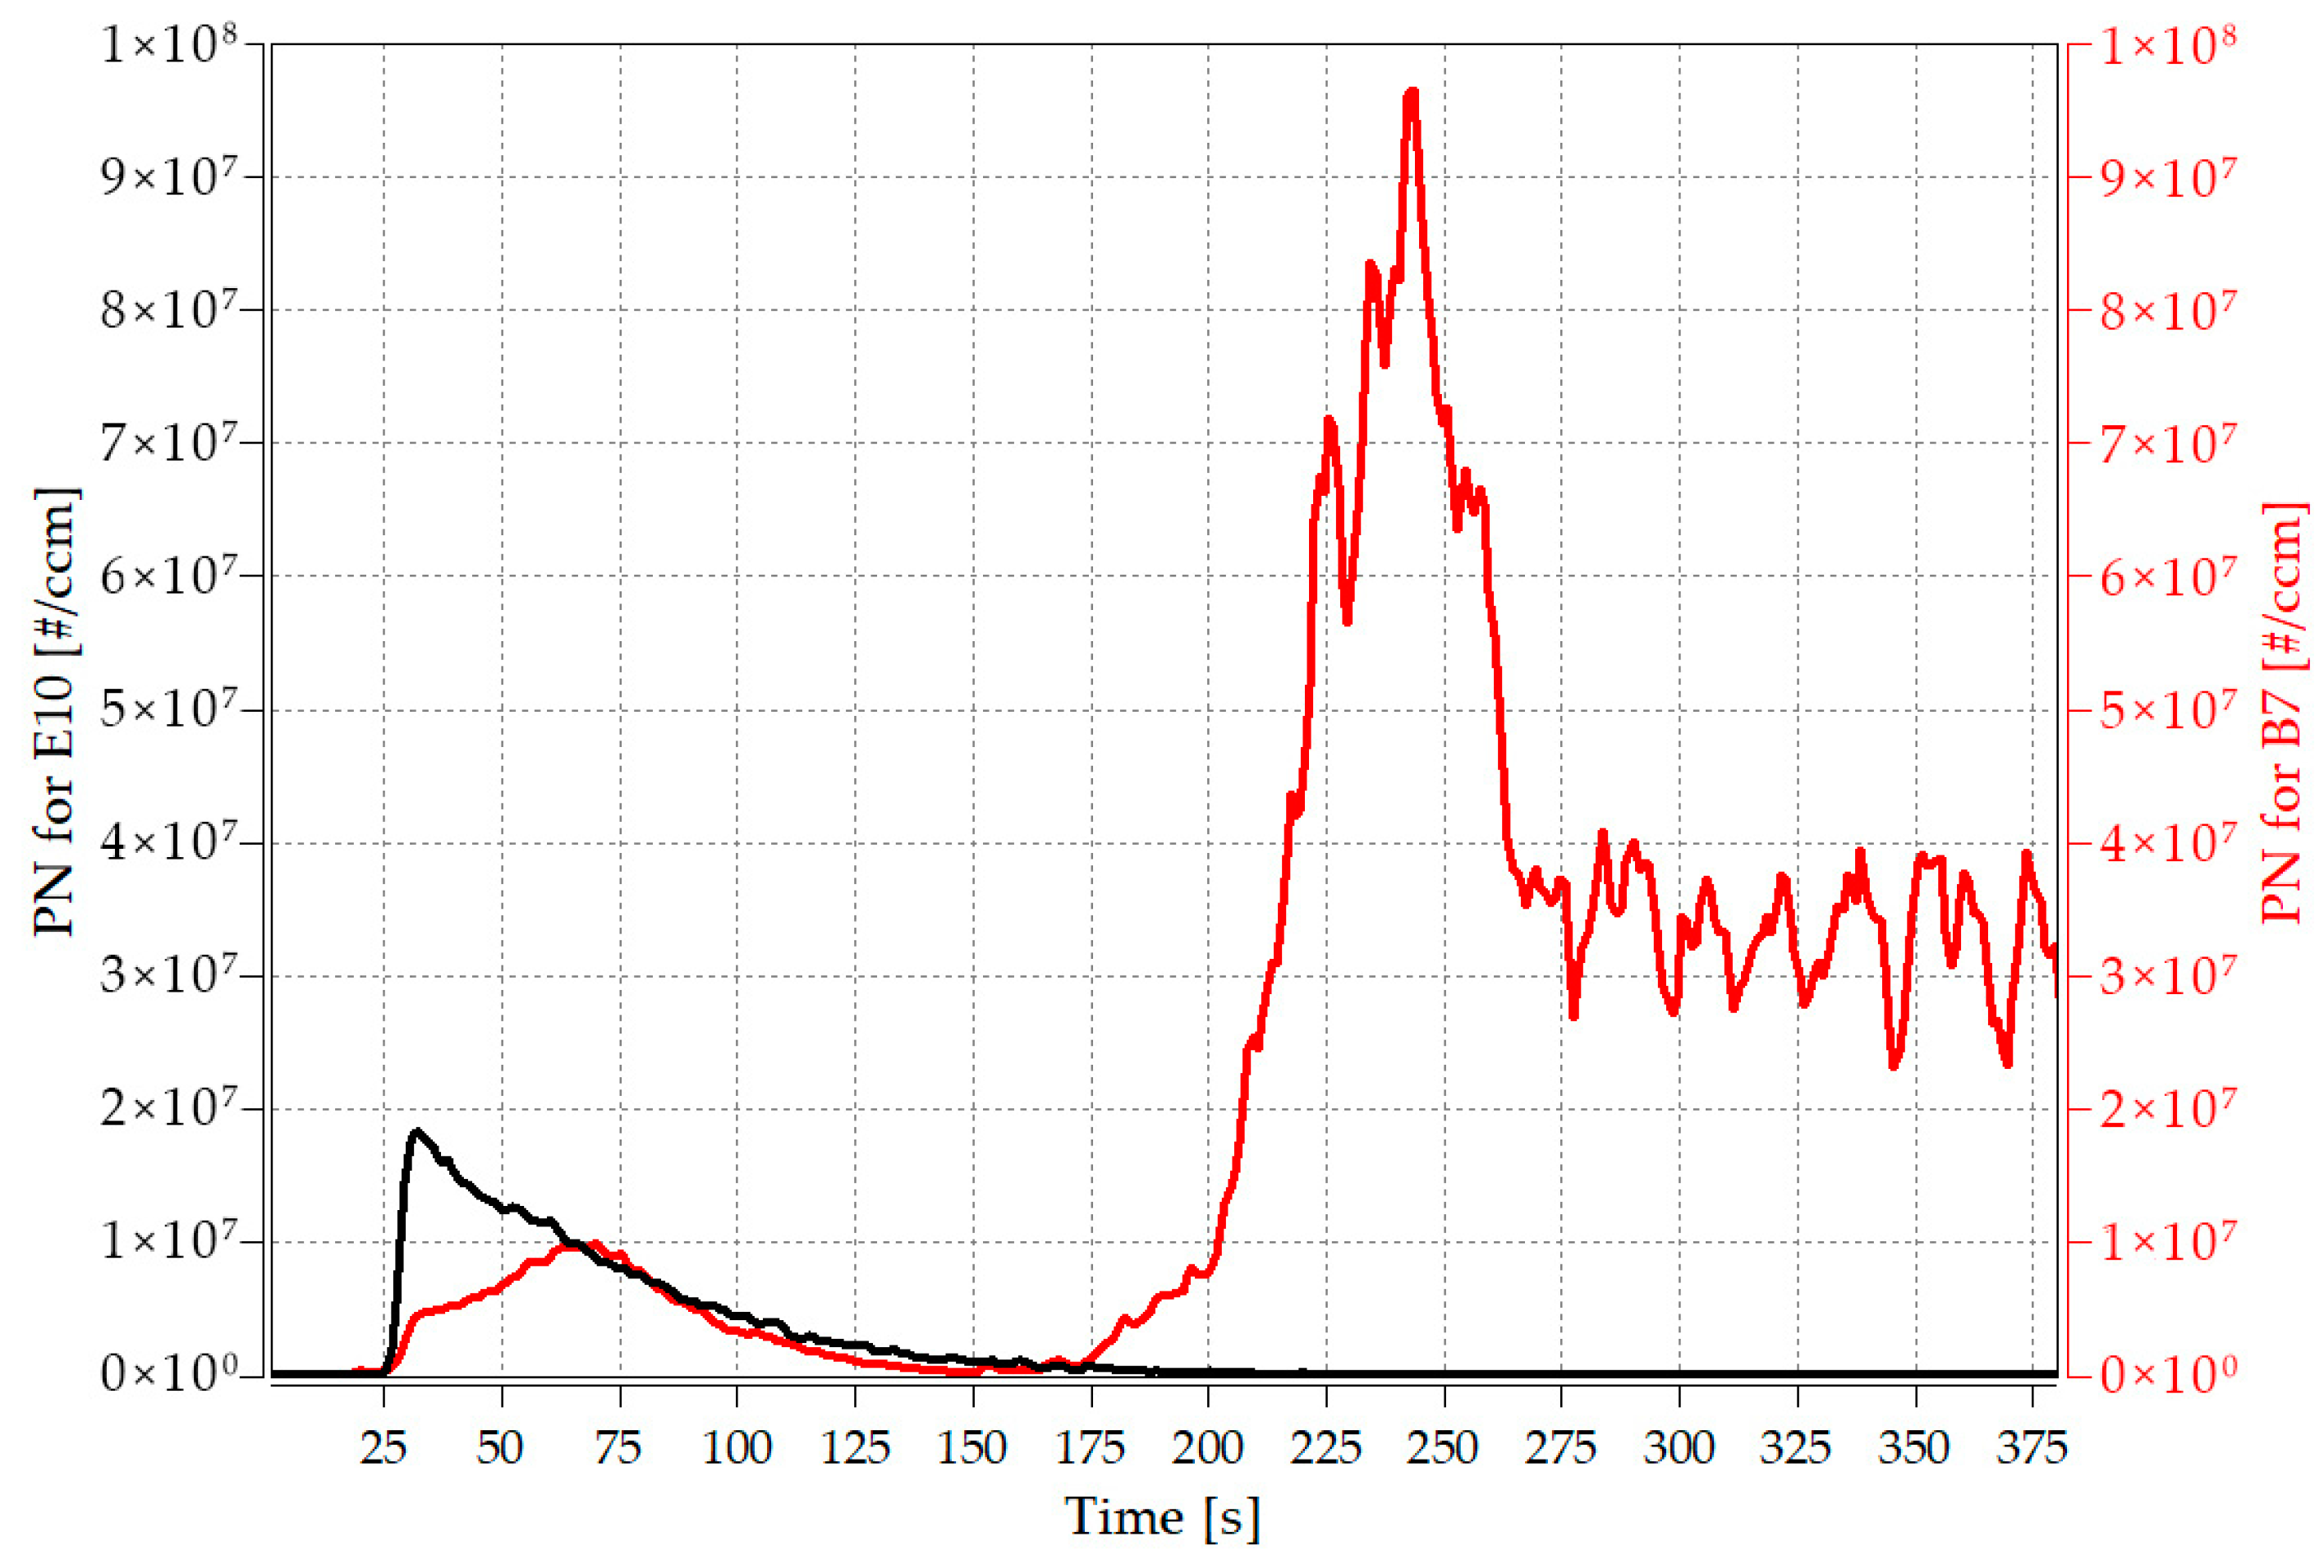
Figure 16.
Operating parameters of E10 and B7 during startup phase (upper part: Air coefficient; Middle part: Fan and fuel pump; lower part: flame temperature).
Figure 16.
Operating parameters of E10 and B7 during startup phase (upper part: Air coefficient; Middle part: Fan and fuel pump; lower part: flame temperature).
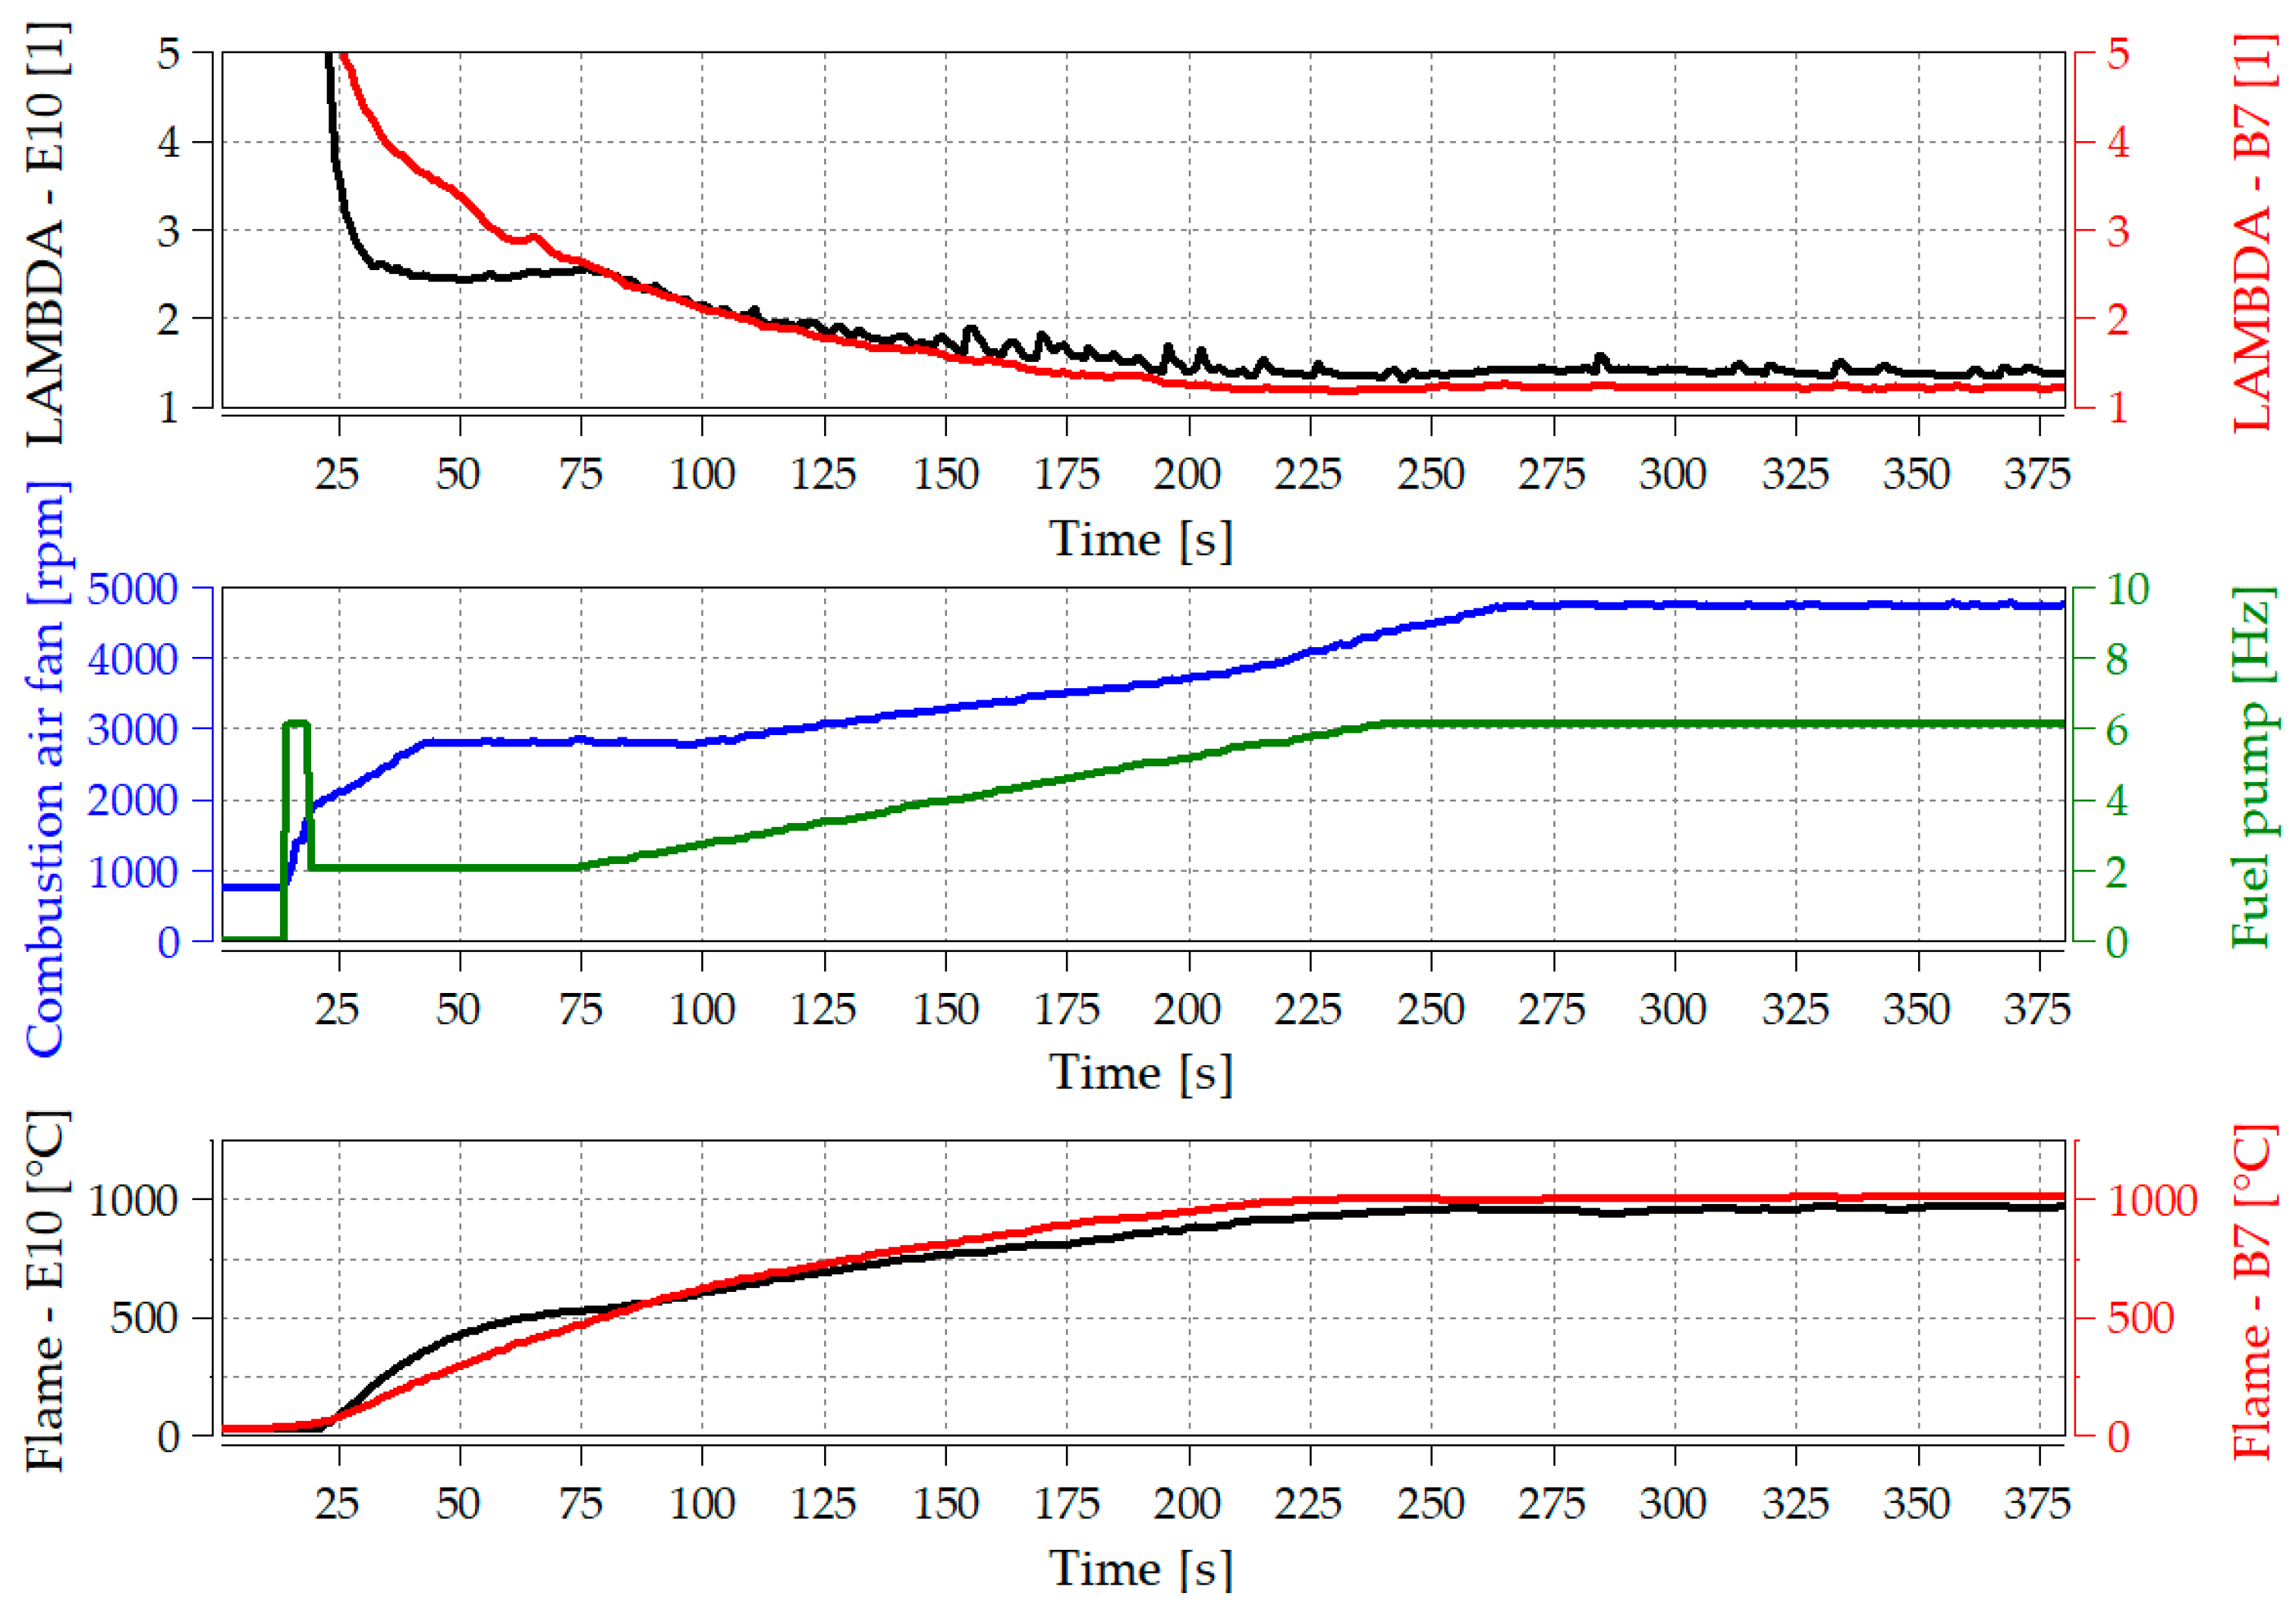
Figure 17.
Changes in particle number concentration of E10 and B7 during the steady state stage.
Figure 17.
Changes in particle number concentration of E10 and B7 during the steady state stage.
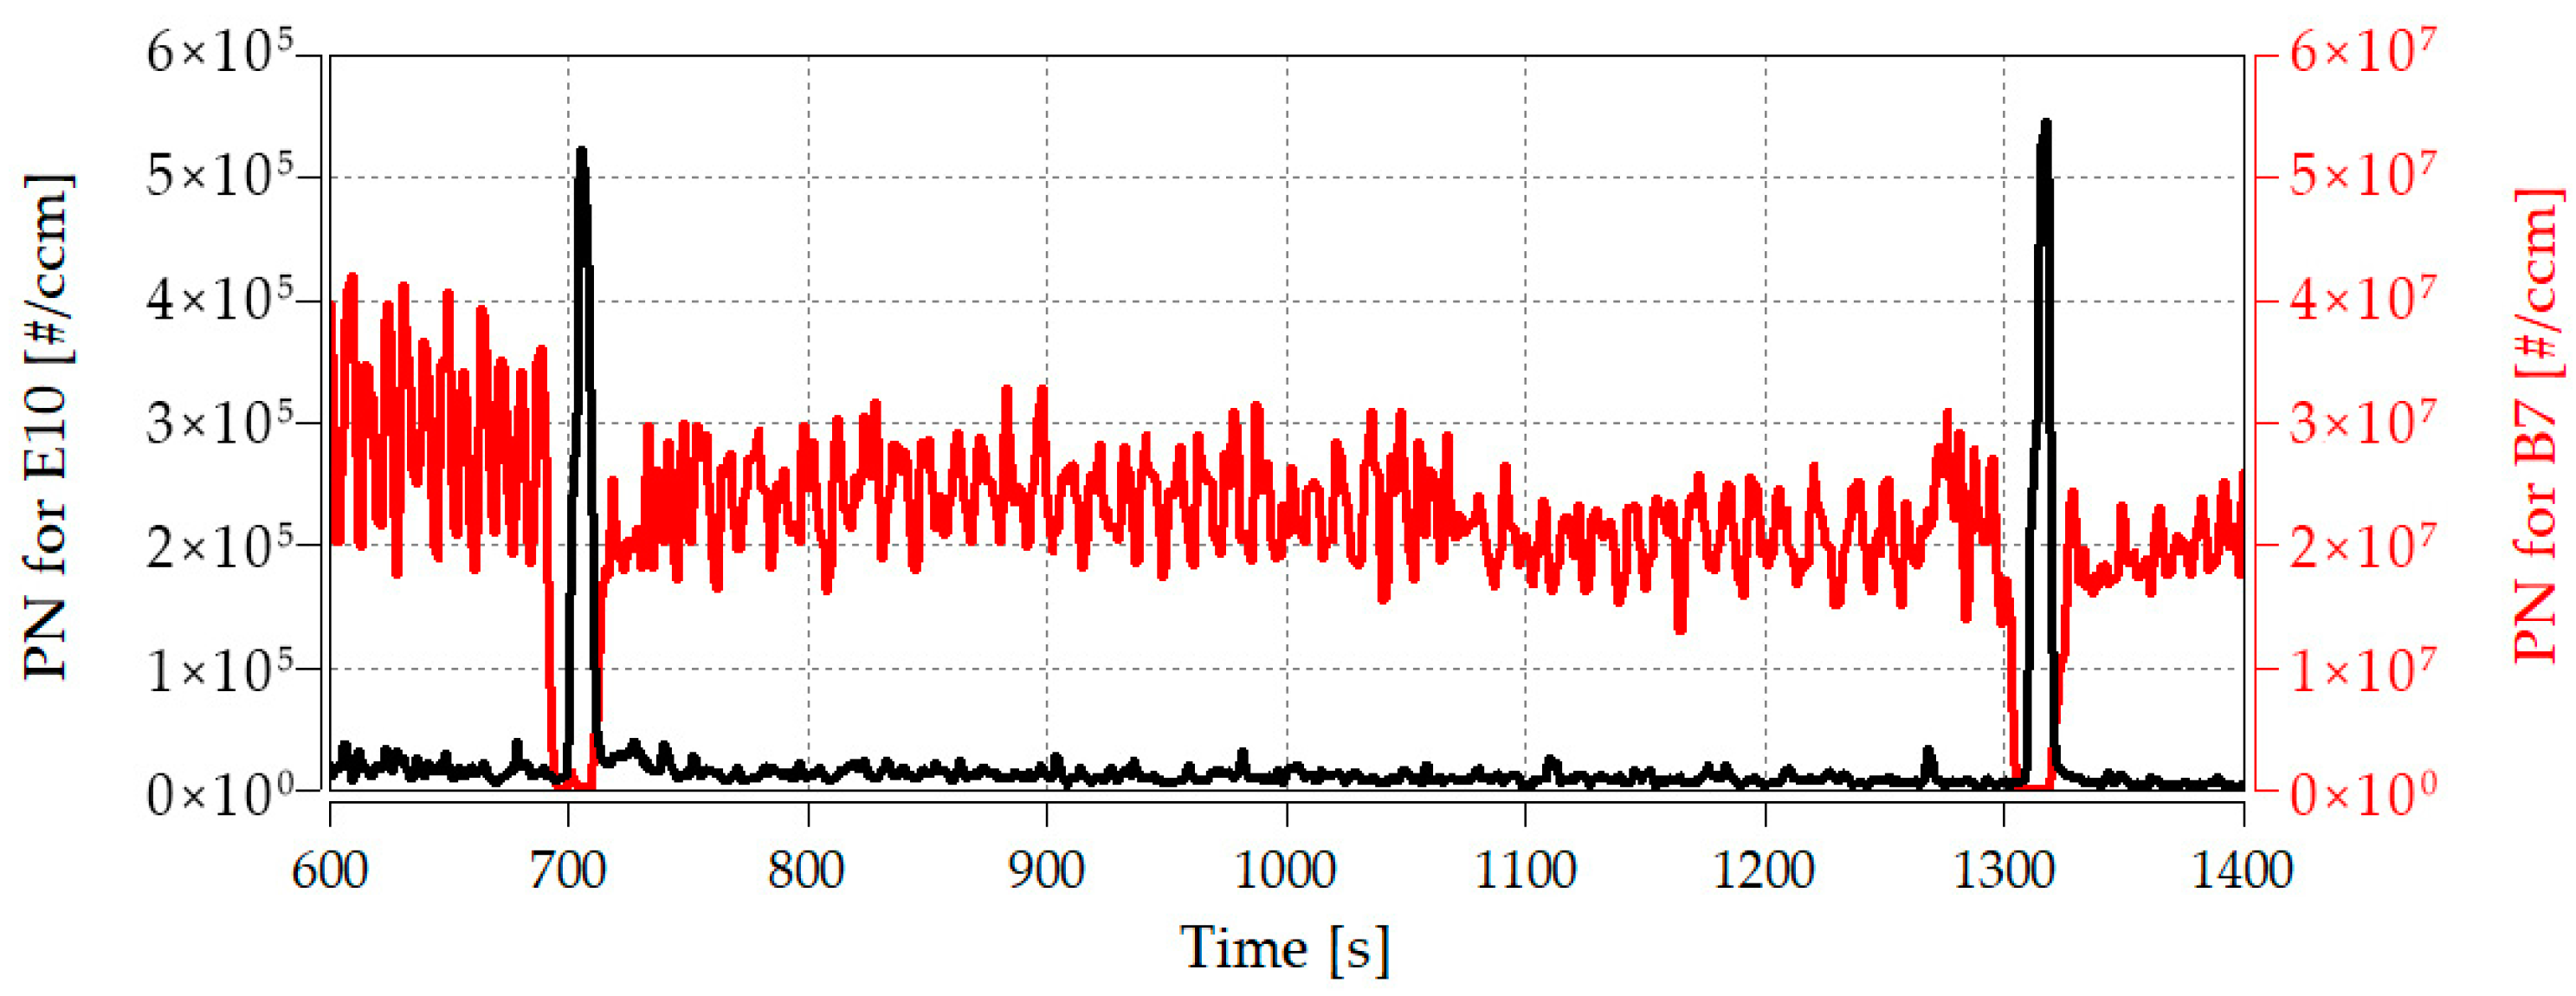
Figure 18.
The operating parameters of E10 and B7 in the steady state stage (upper part: Air coefficient; Middle part: Fan and fuel pump; lower part: flame temperature).
Figure 18.
The operating parameters of E10 and B7 in the steady state stage (upper part: Air coefficient; Middle part: Fan and fuel pump; lower part: flame temperature).
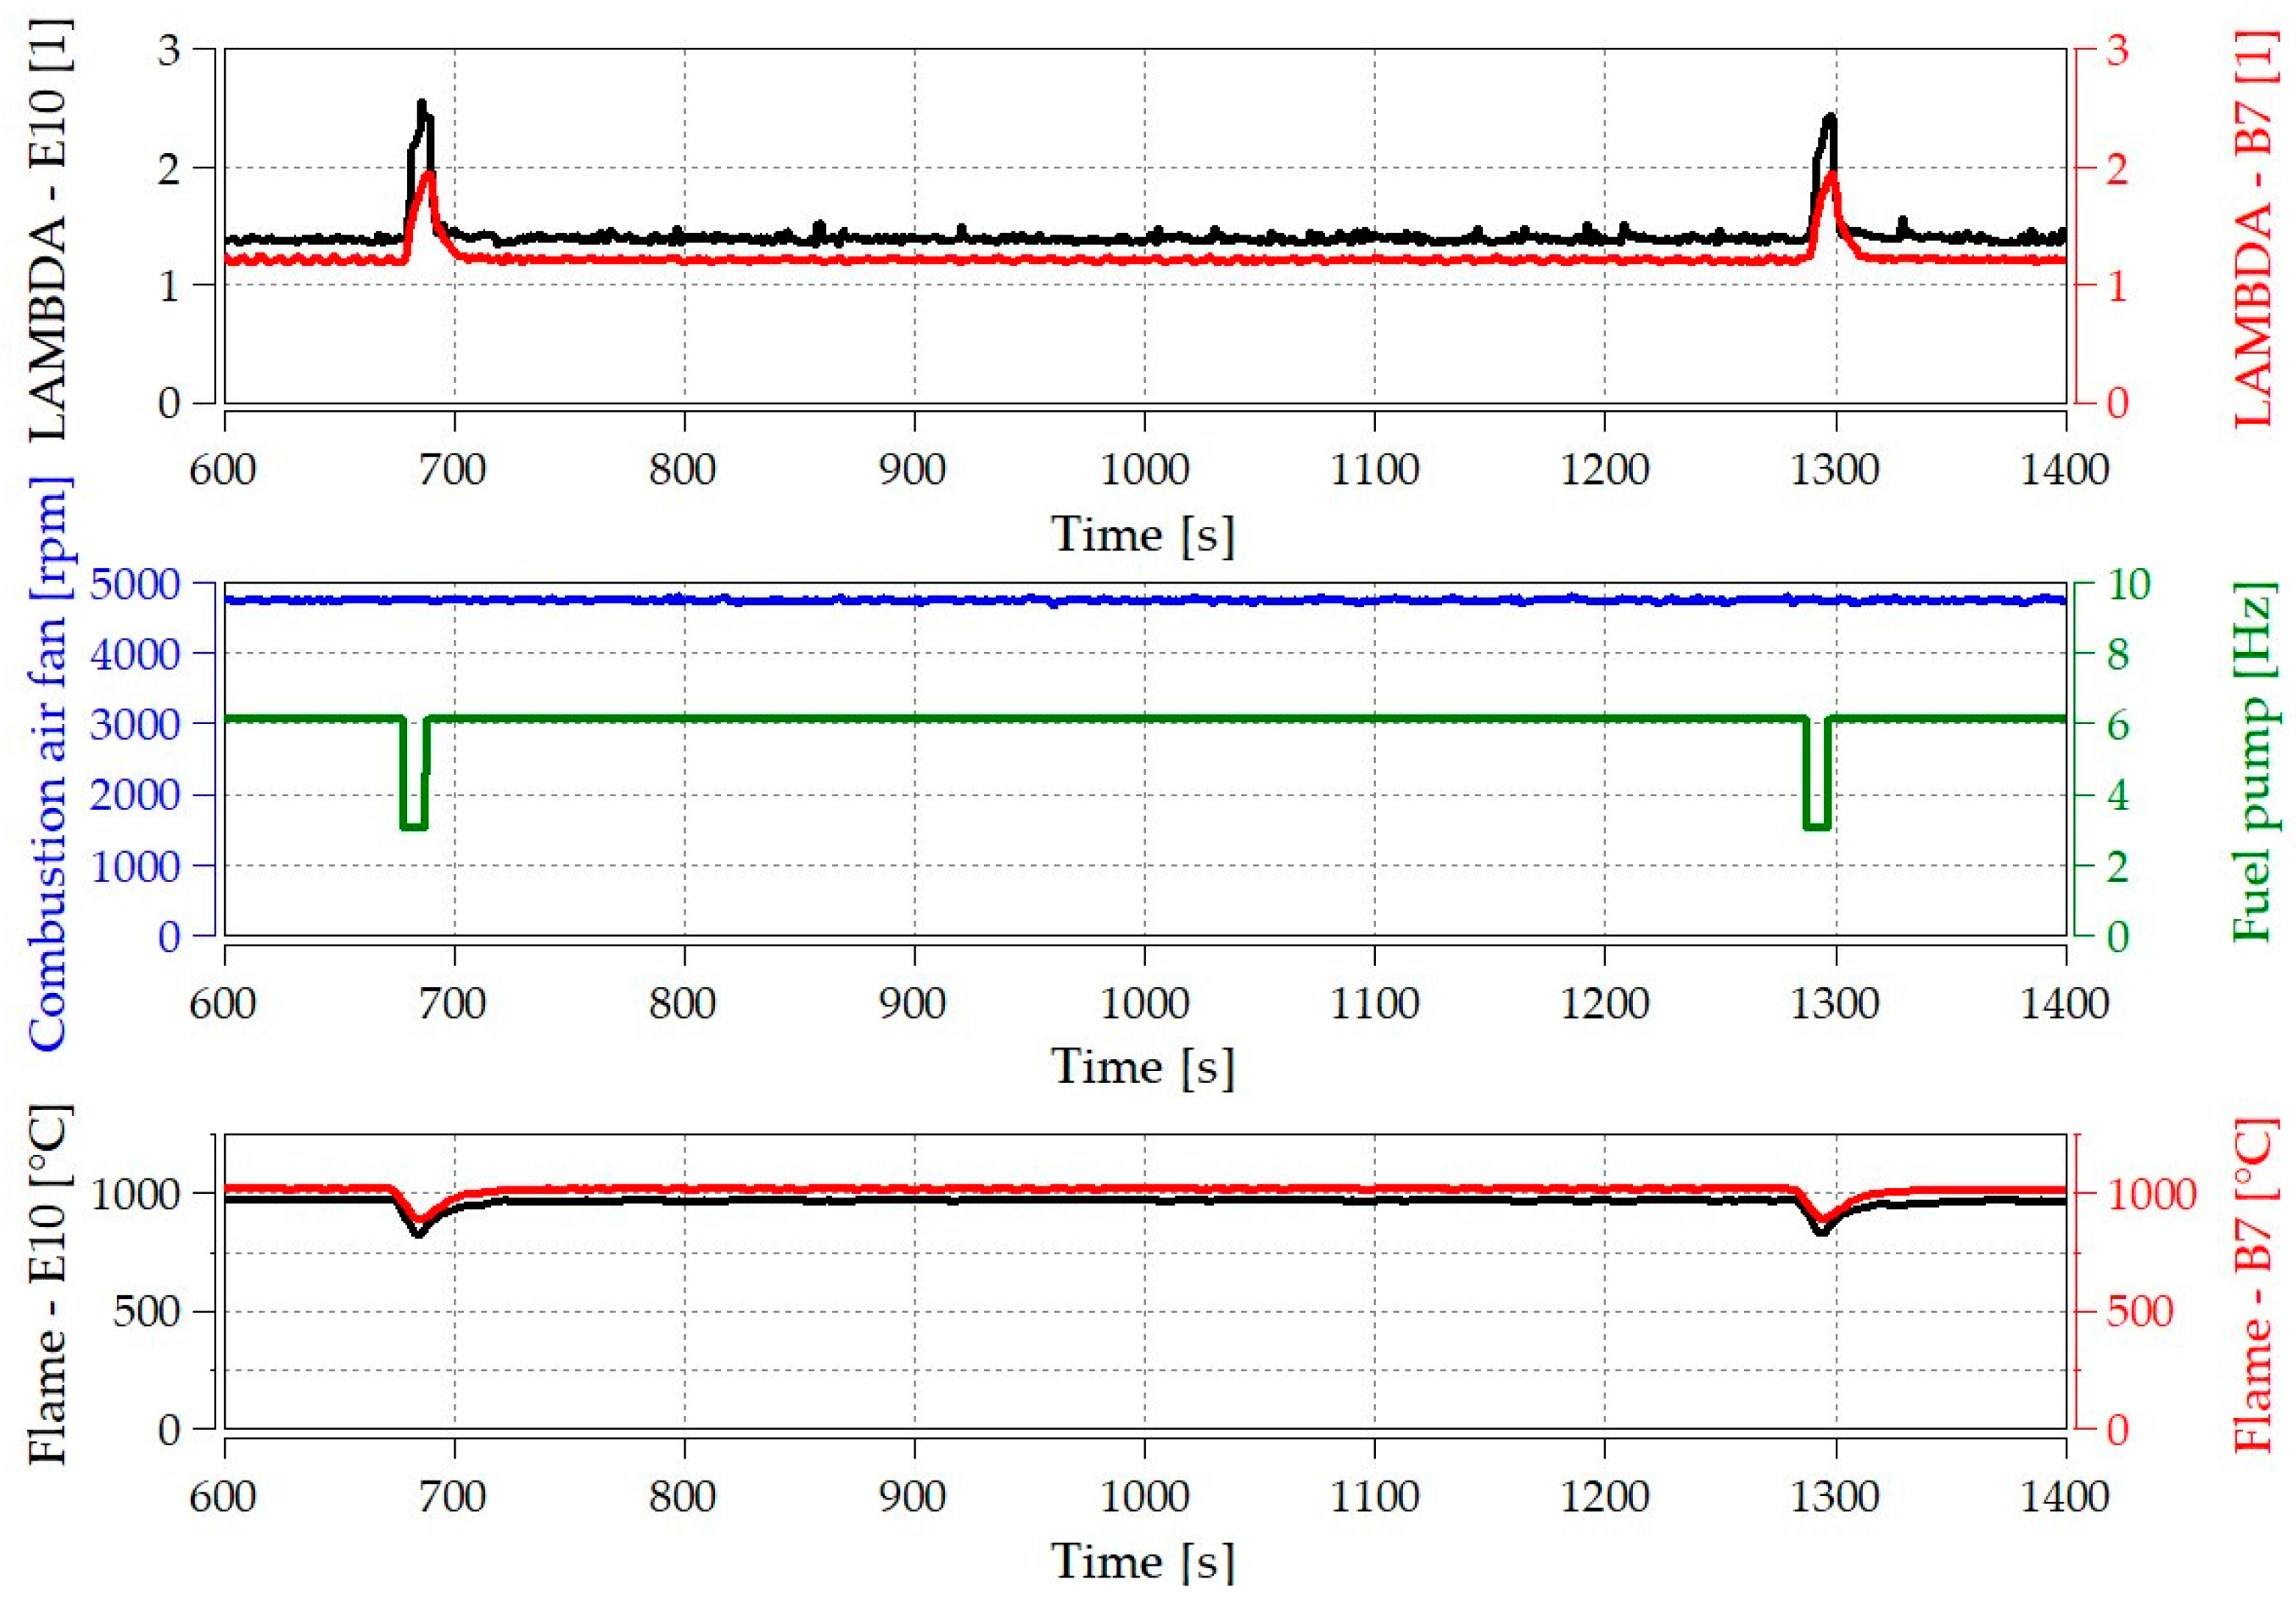
Figure 19.
Changes in particle number concentration of E10 and B7 during the burnout stage.
Figure 19.
Changes in particle number concentration of E10 and B7 during the burnout stage.
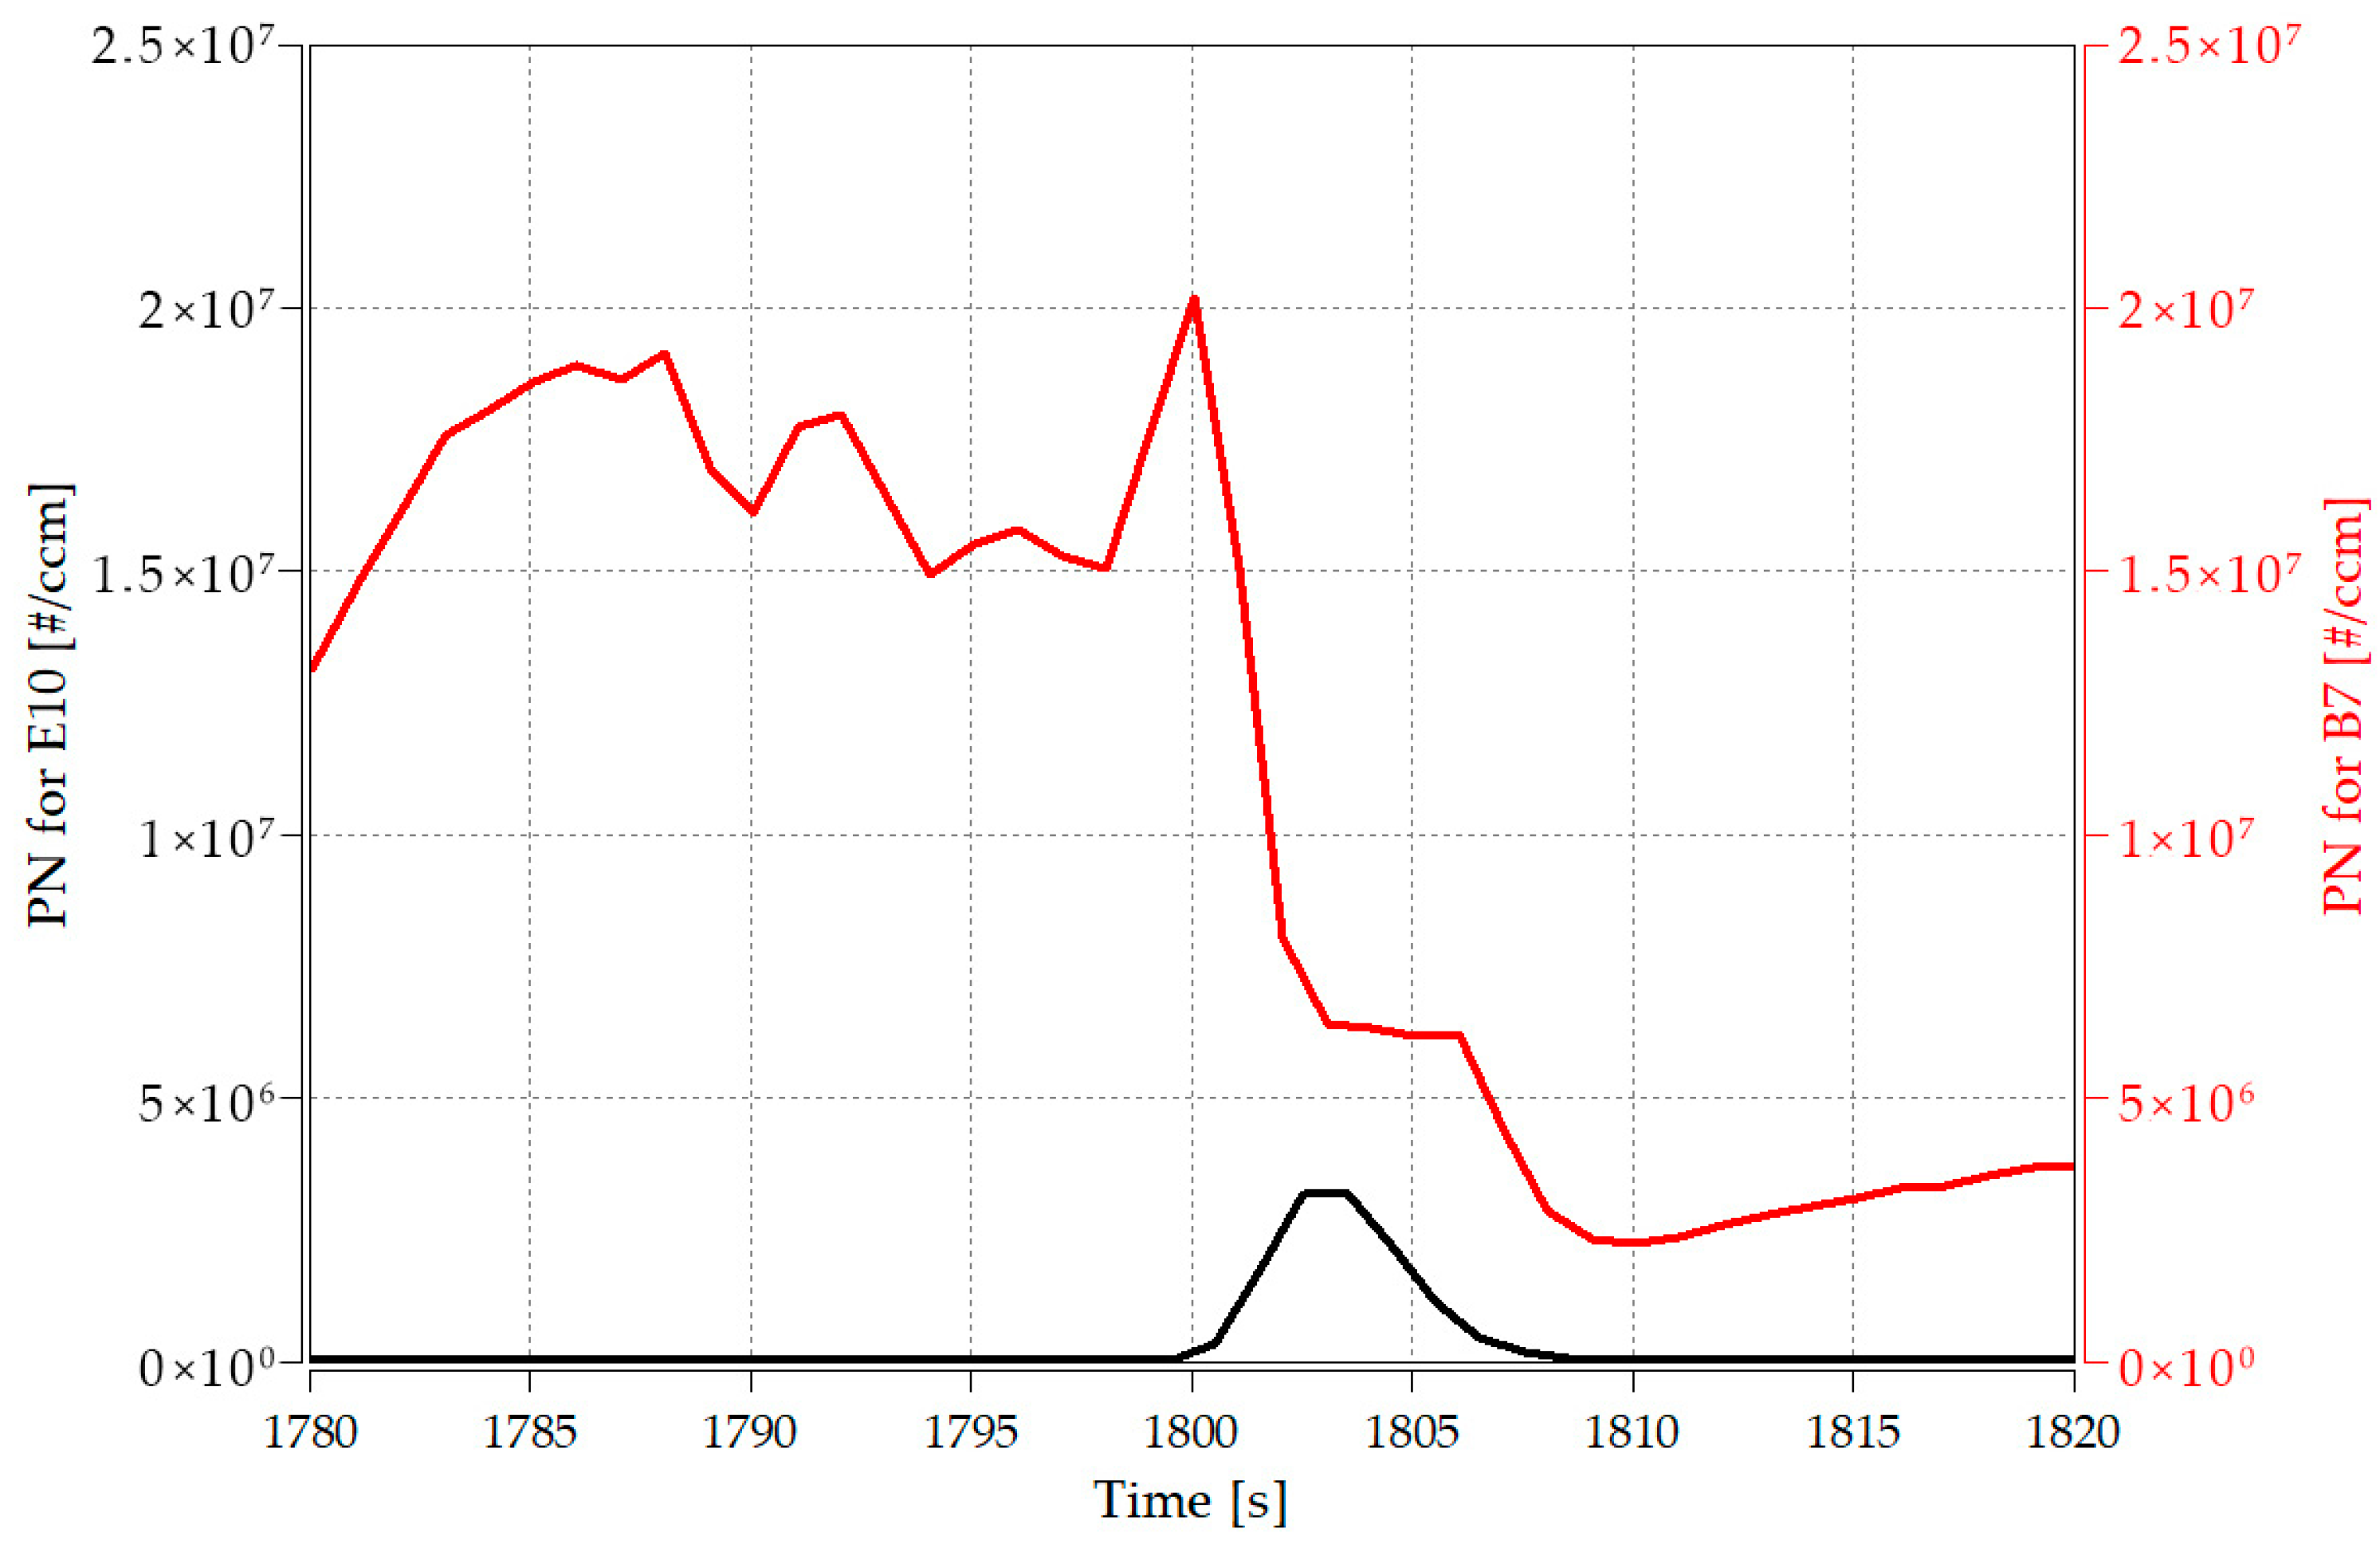
Figure 20.
Operating parameters of E10 and B7 in the burnout stage (upper part: Air coefficient; Middle part: Fan and fuel pump; lower part: flame temperature).
Figure 20.
Operating parameters of E10 and B7 in the burnout stage (upper part: Air coefficient; Middle part: Fan and fuel pump; lower part: flame temperature).
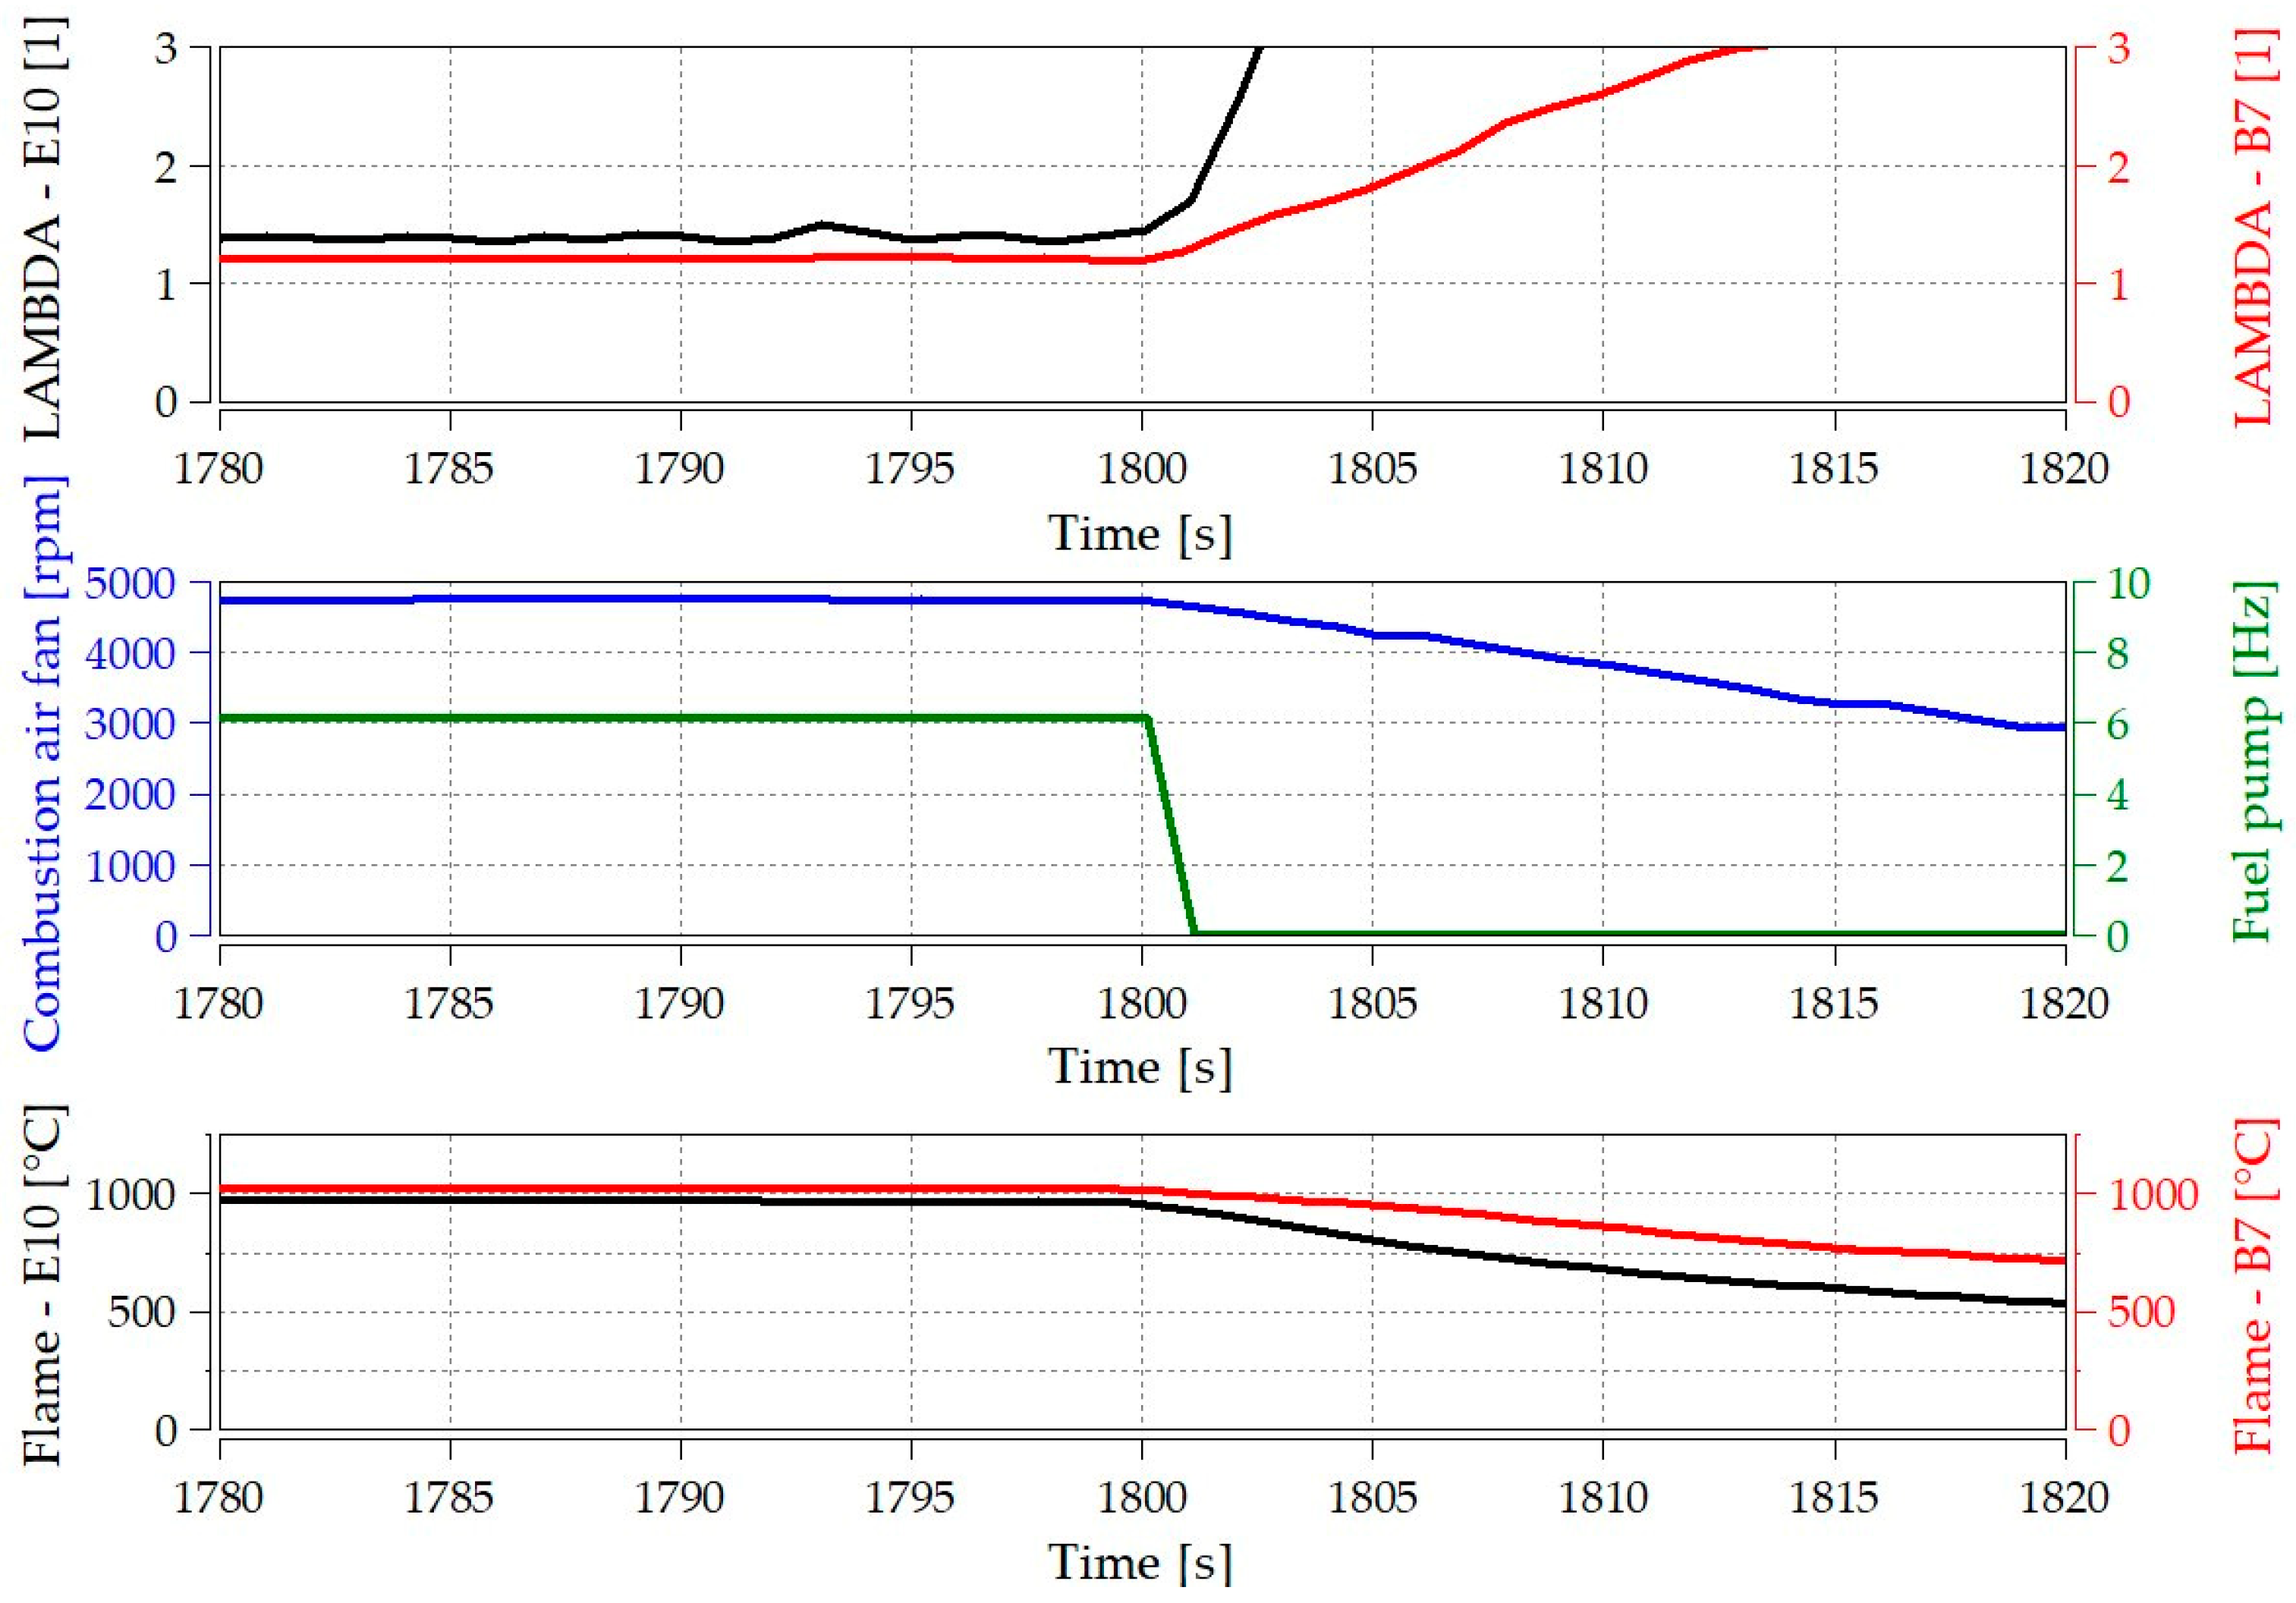
Figure 21.
The combustion chamber is in a clean state (left) and after using it for a period of time (correct) (No.: 1—pore, 2—evaporator, 3—glow plug, 4—sediment).
Figure 21.
The combustion chamber is in a clean state (left) and after using it for a period of time (correct) (No.: 1—pore, 2—evaporator, 3—glow plug, 4—sediment).
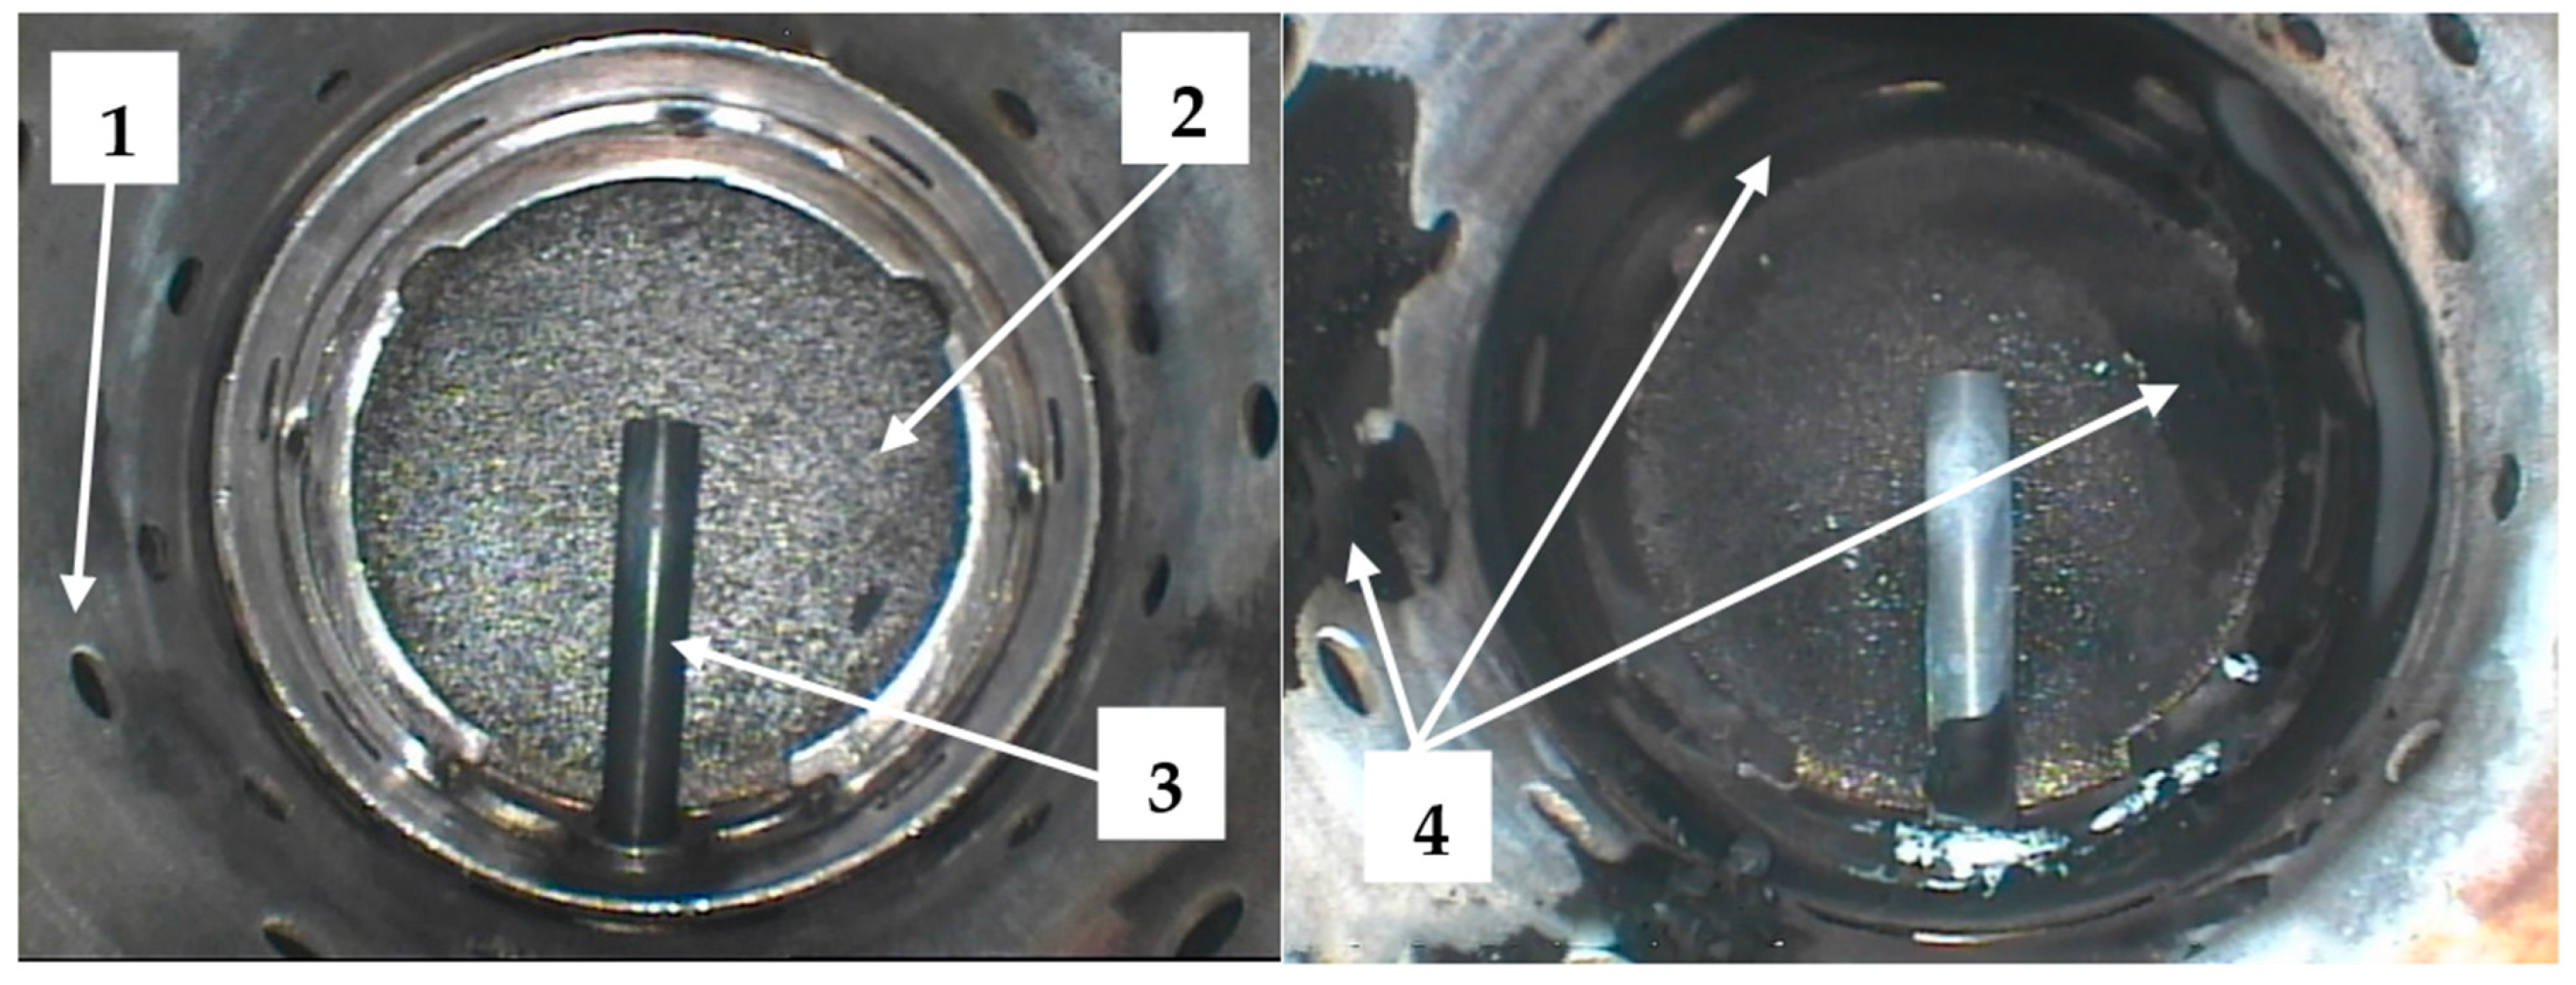
Figure 22.
Amount of soot deposited in the burner basket as a function of changes in bioethanol—visual inspection.
Figure 22.
Amount of soot deposited in the burner basket as a function of changes in bioethanol—visual inspection.
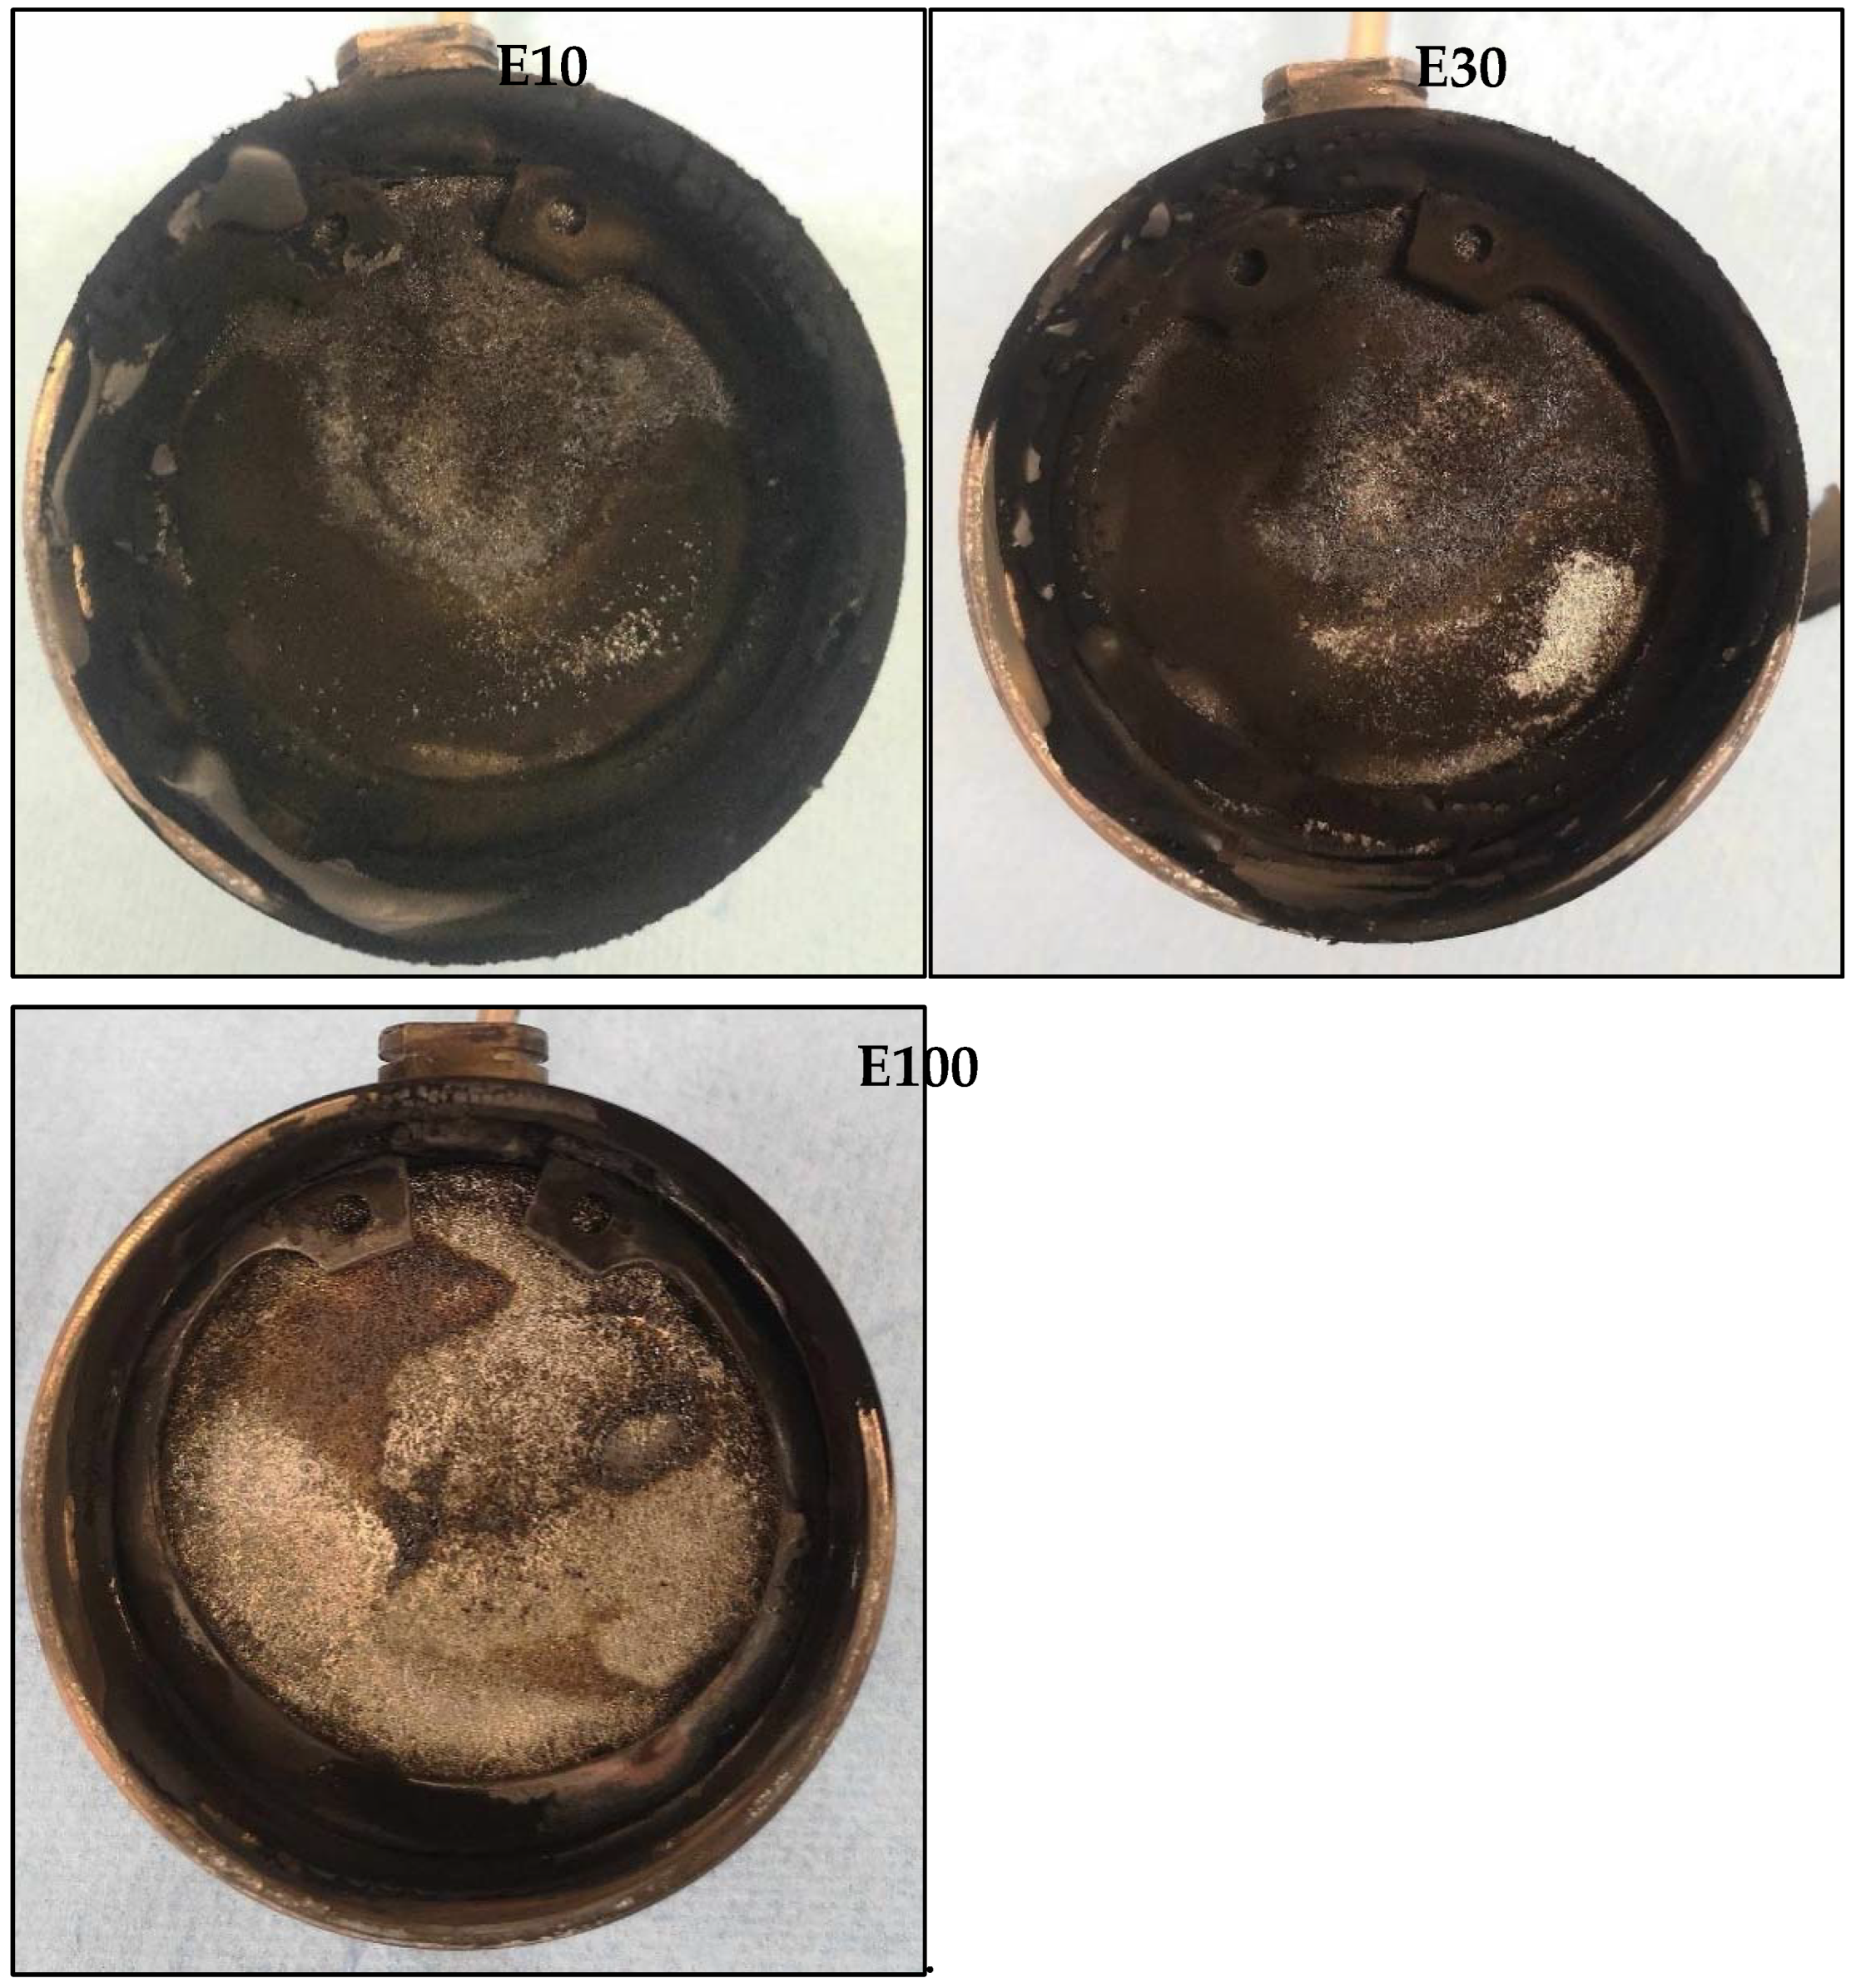
Figure 23.
Elemental composition of soot particles produced during the combustion of fuels containing different percentages of ethanol.
Figure 23.
Elemental composition of soot particles produced during the combustion of fuels containing different percentages of ethanol.
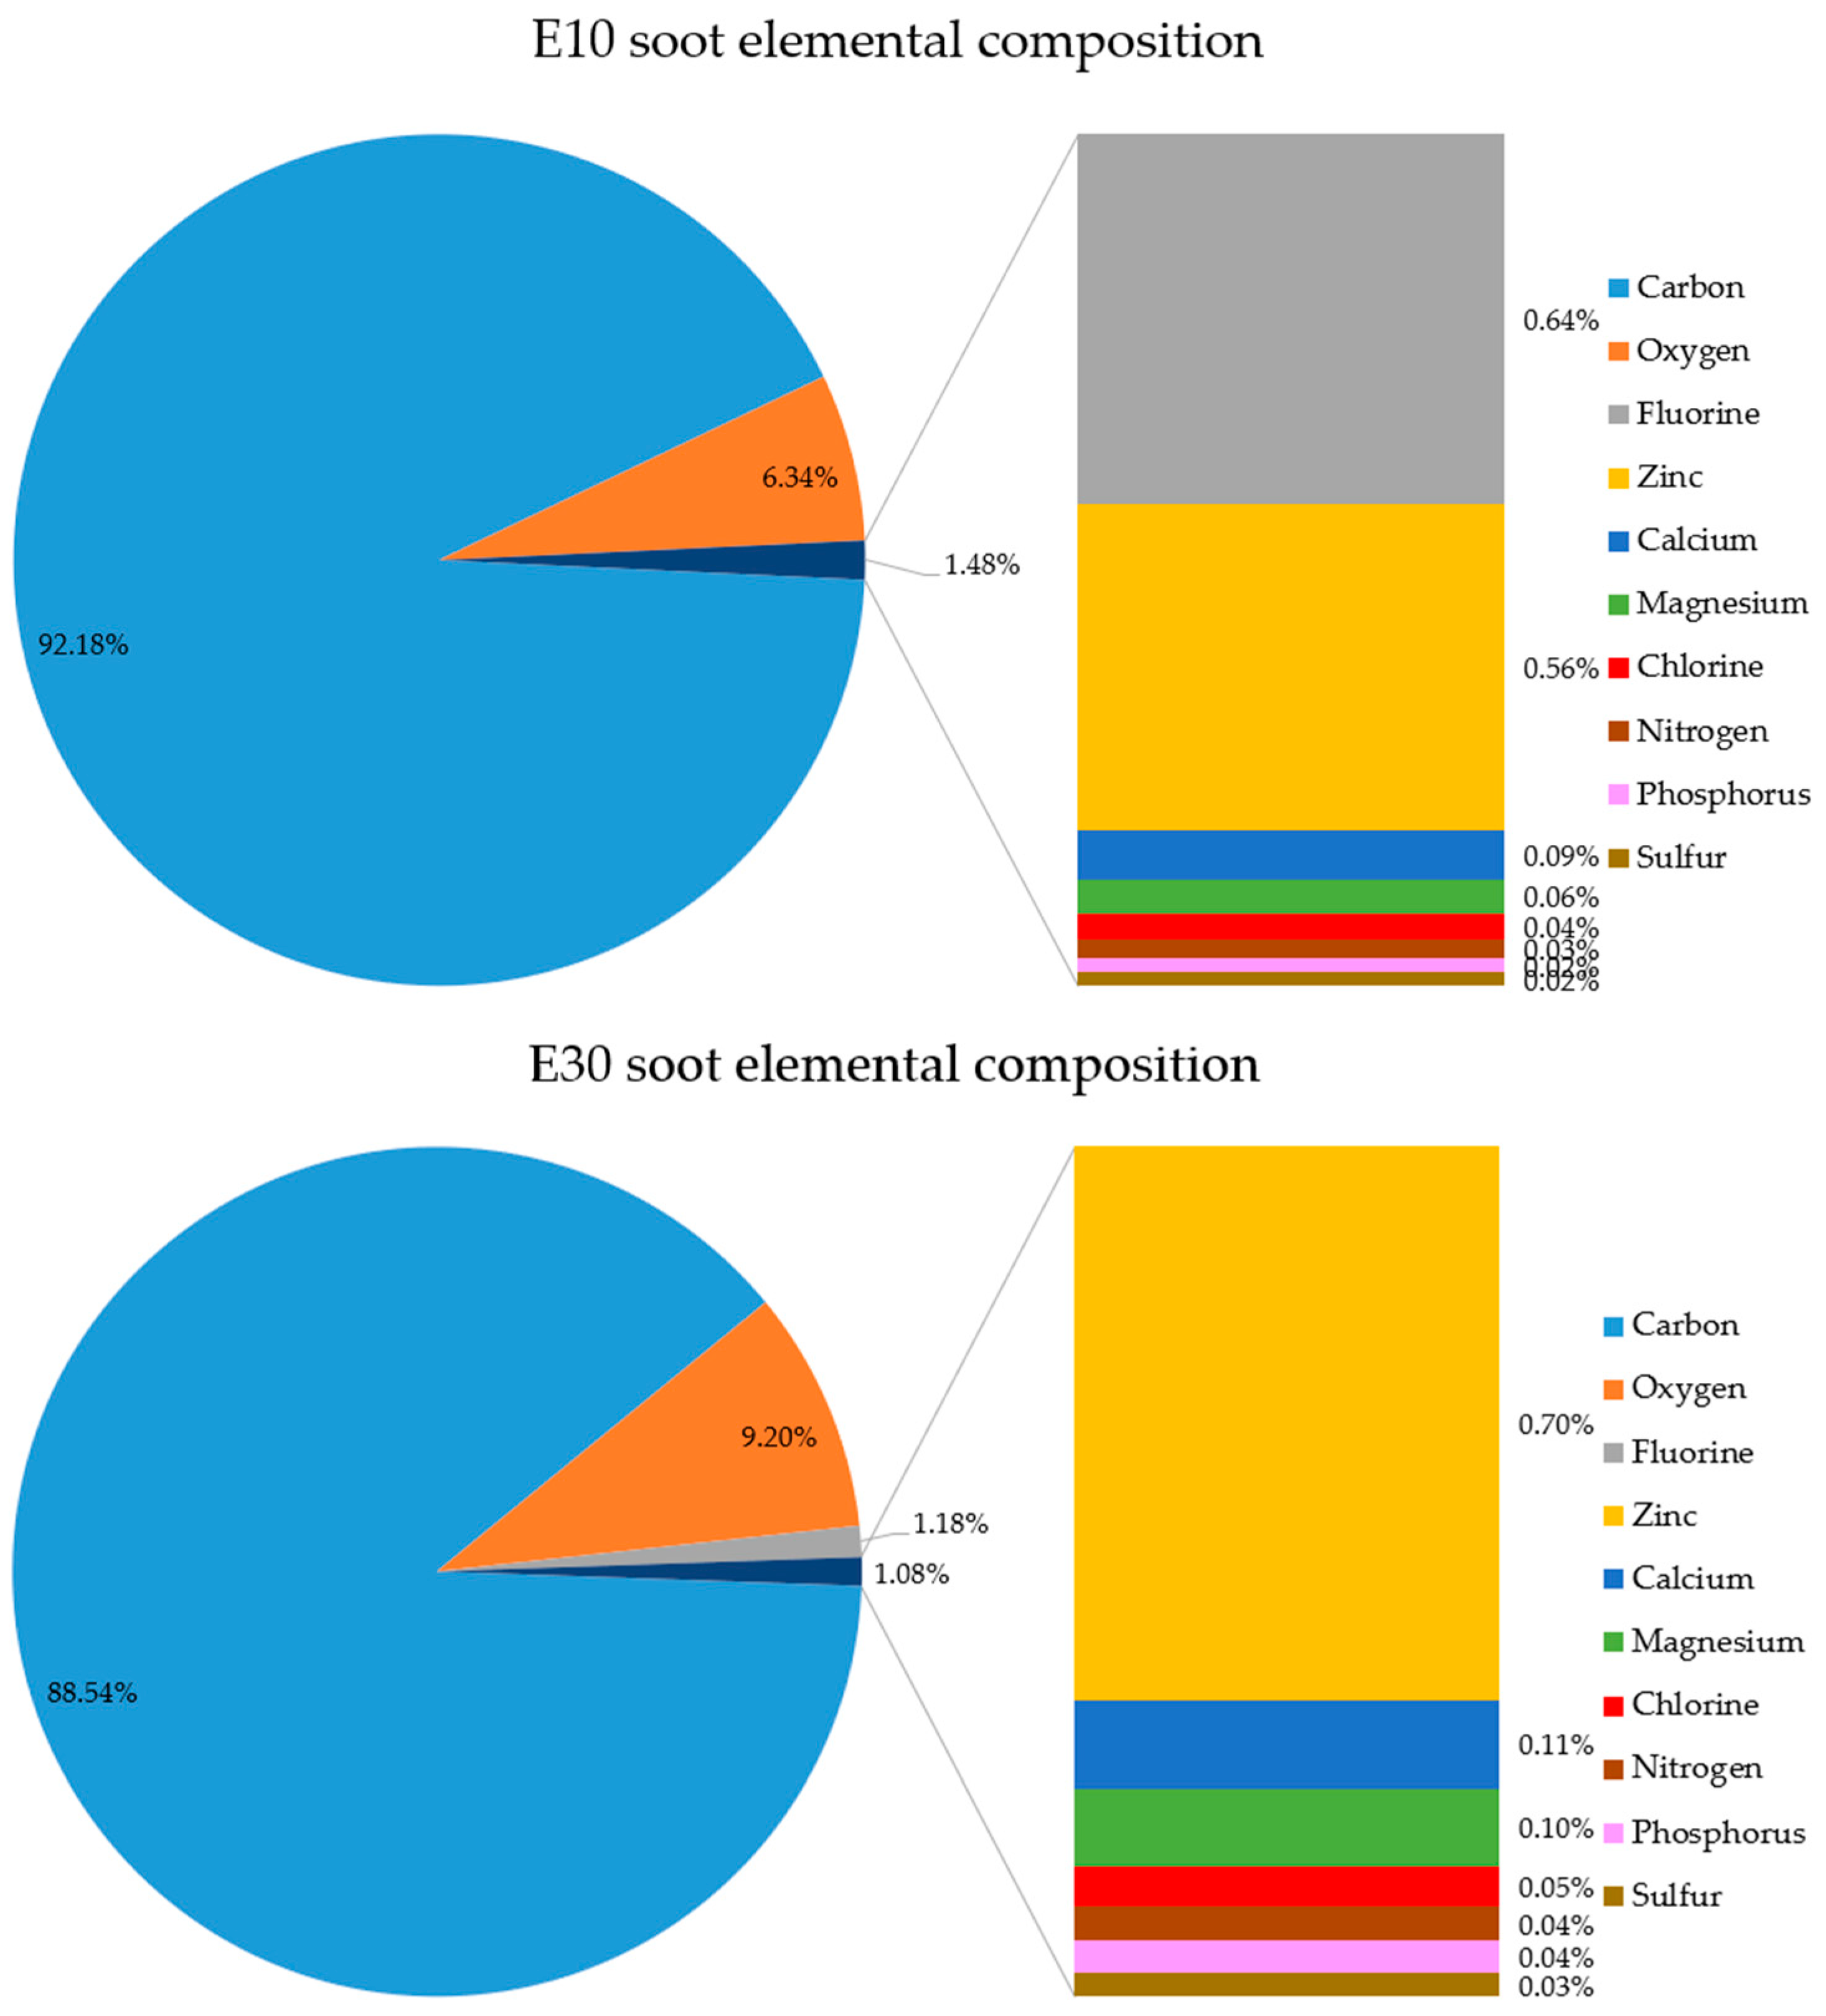
Figure 24.
The mass percent ratio of the carbon and oxygen content of the soot sample to the ethanol content of the fuel.
Figure 24.
The mass percent ratio of the carbon and oxygen content of the soot sample to the ethanol content of the fuel.
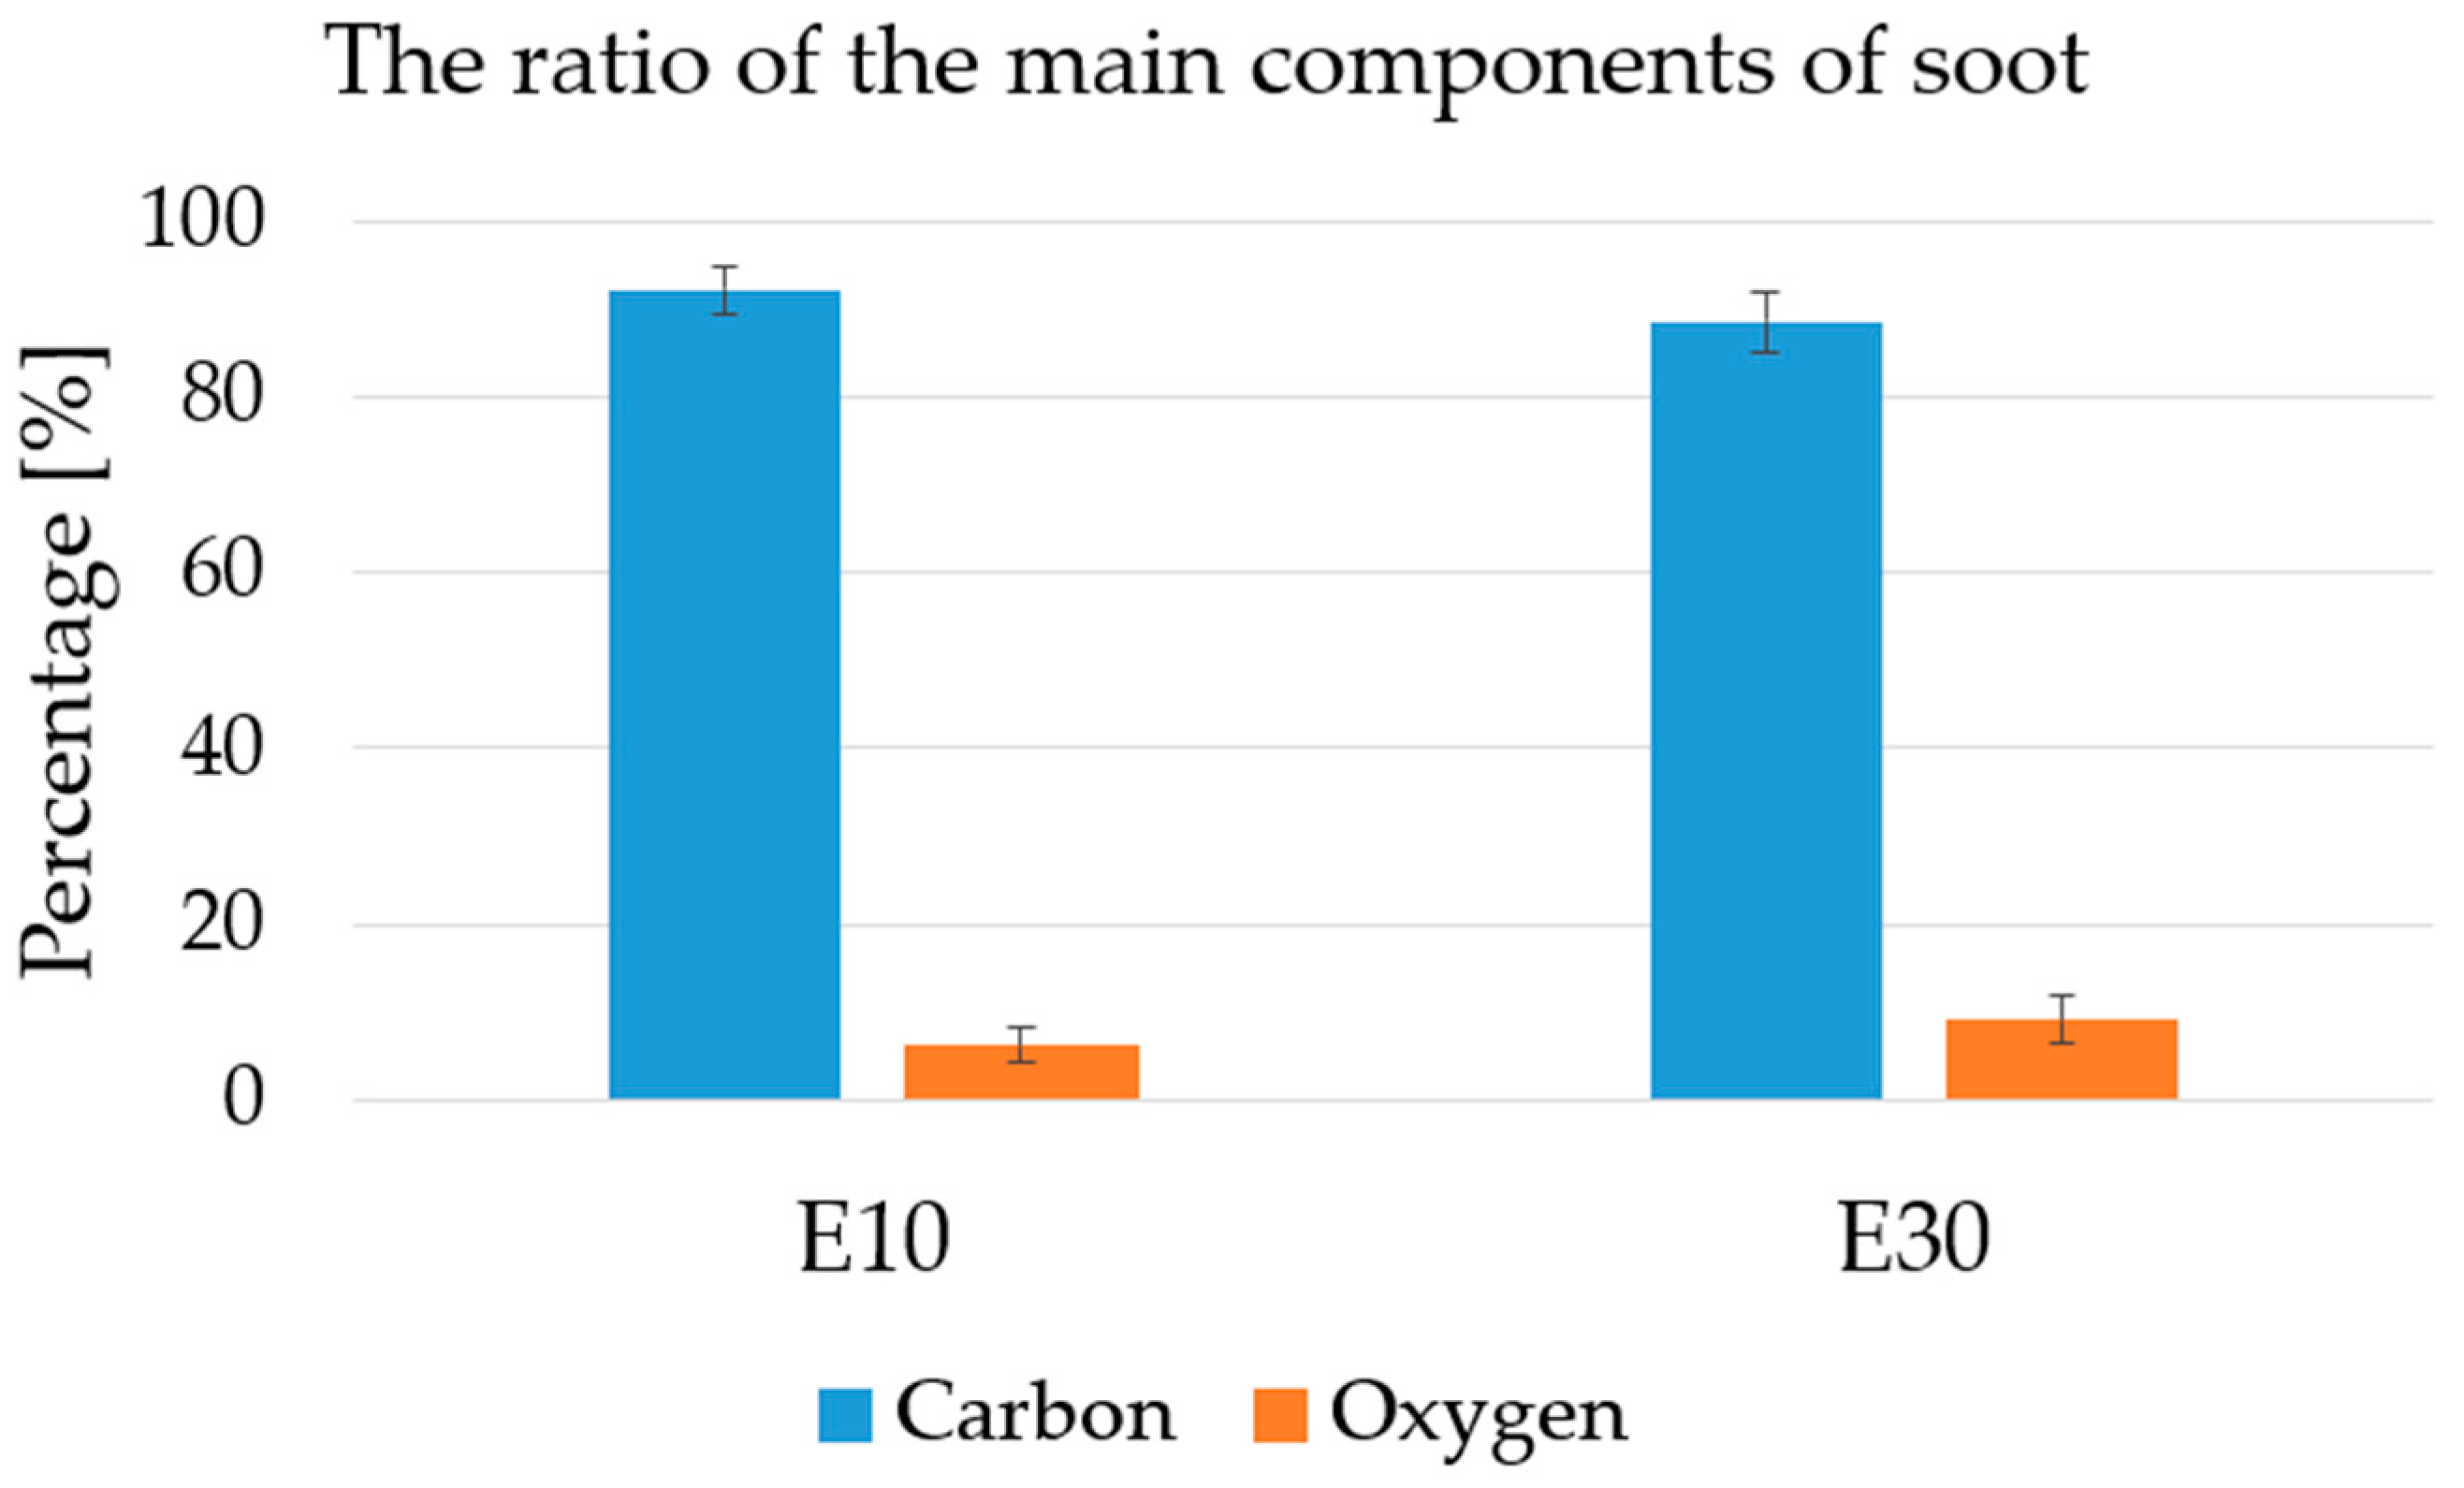
Figure 25.
The mass percentages of fluorine and zinc content in the soot samples were compared to the ethanol content in the fuel.
Figure 25.
The mass percentages of fluorine and zinc content in the soot samples were compared to the ethanol content in the fuel.
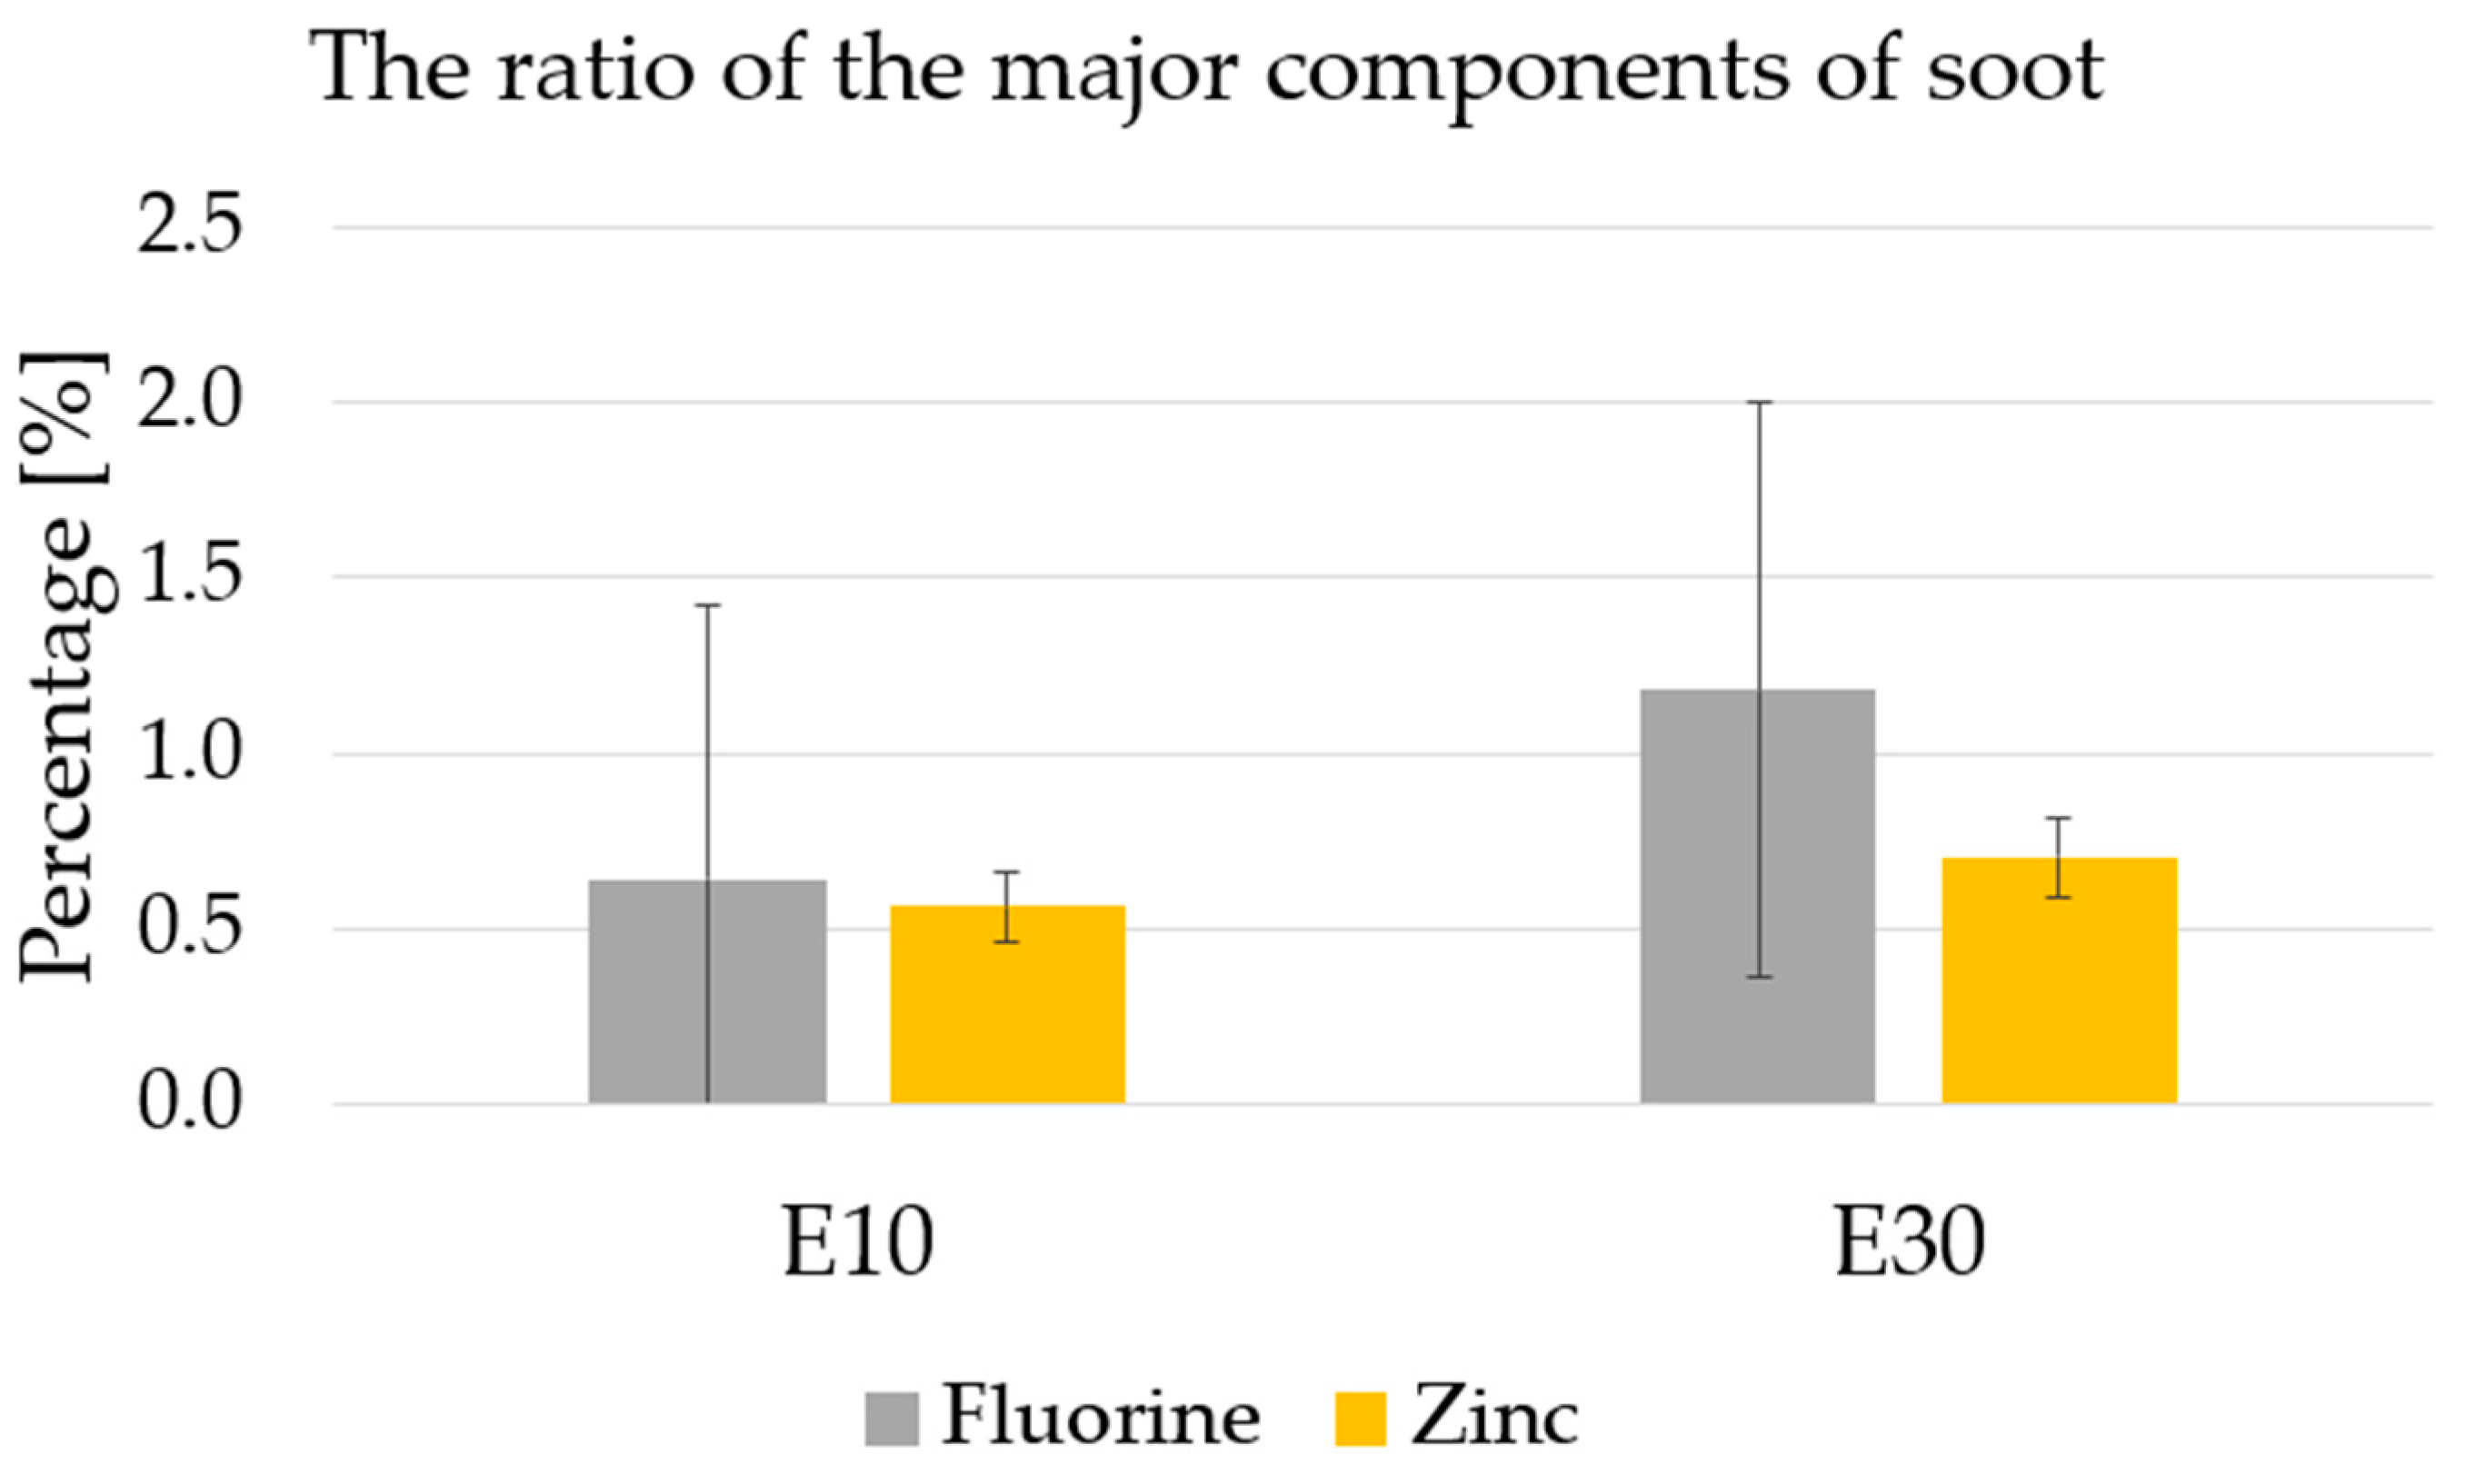
Figure 26.
The mass percentage of soot trace components and fuel ethanol content.
Figure 26.
The mass percentage of soot trace components and fuel ethanol content.
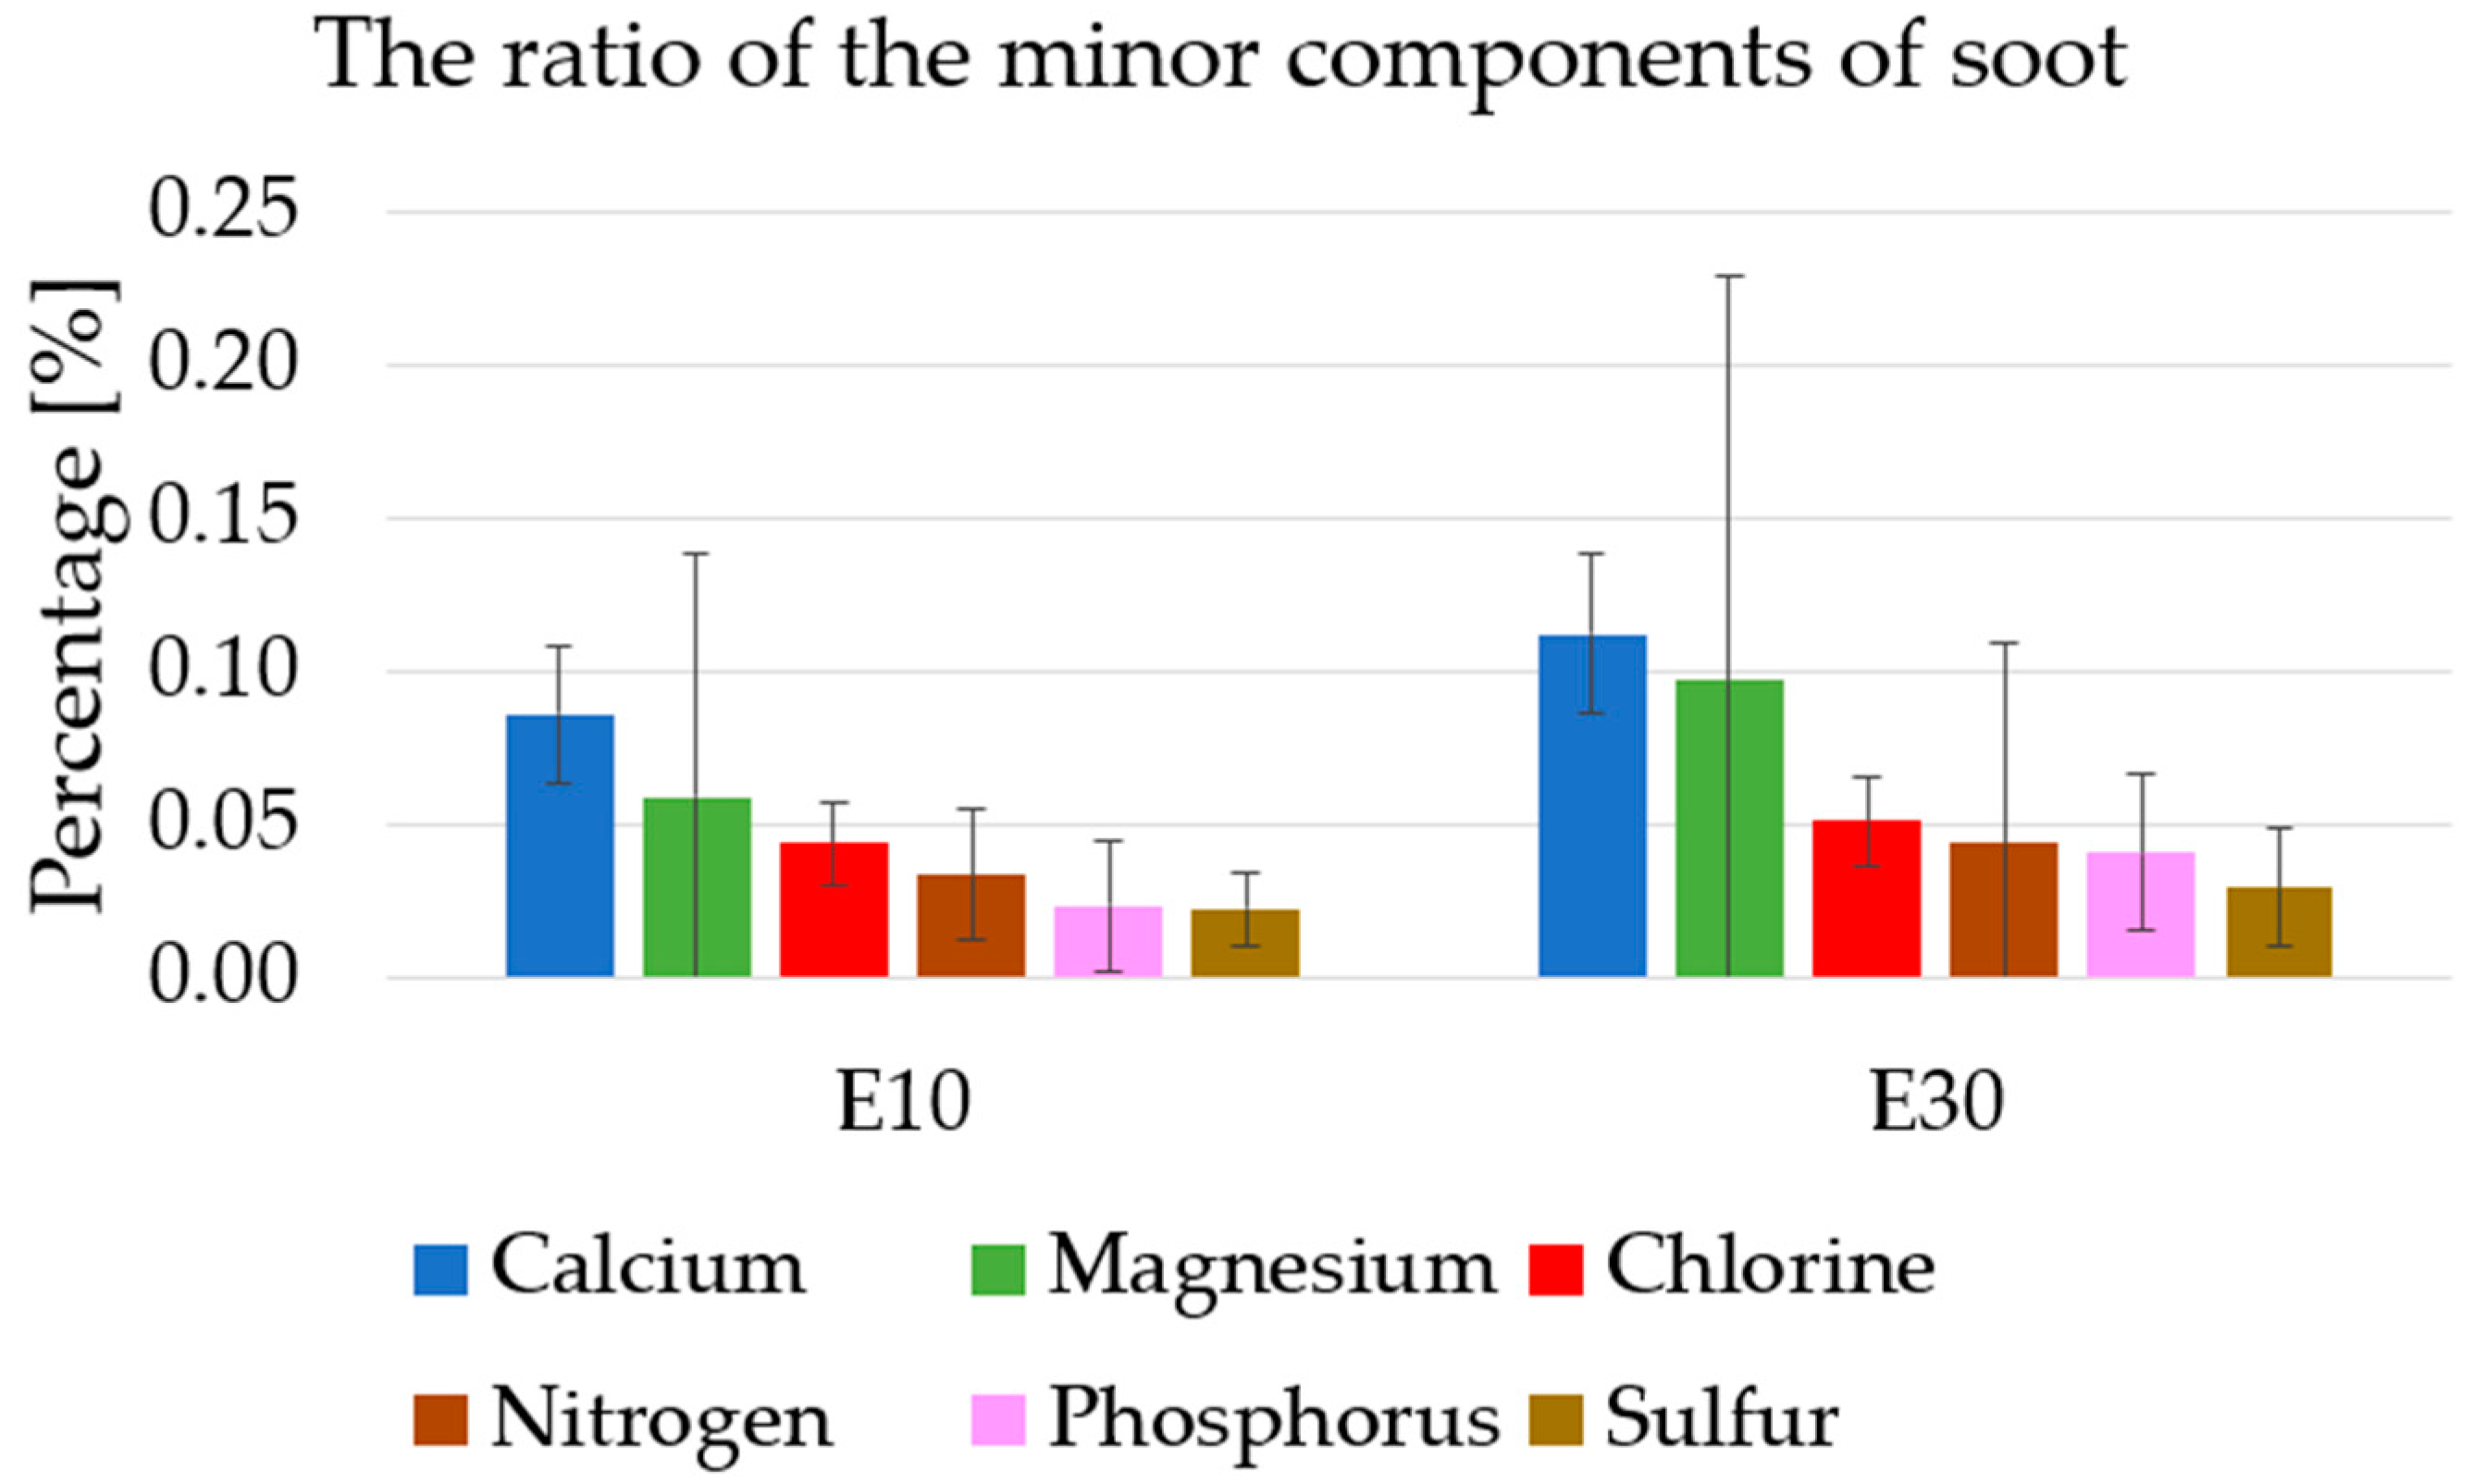
Table 1.
Research fuels and their standards.
Table 1.
Research fuels and their standards.
| Investigate fuel | Related standards |
|---|---|
| E10 | EN 228 [8] |
| E30 (mixture of E10 and E100 by volume) | EN 228 and EN 15376 [9] |
| E100 | EN 15376 |
| B7 | EN 590 [7] |
Table 2.
Components of exhaust and chamber analysis measurement systems [own editing].
Table 2.
Components of exhaust and chamber analysis measurement systems [own editing].
| path | scope | equipment | brand, type |
|---|---|---|---|
| Air | Intake air humidity and temperature | Humidity and temperature sensors | Vaisala HMT310 |
| combustion | flame temperature | Thermocouple | Type N sensor with QuantumX MX1609B |
| excess air ratio | Oxygen Sensor | Bosch LSU 4.9 wideband sensor with ETAS ES636.1 module | |
| exhaust | Exhaust gas temperature | Thermocouple | Type K sensor with QuantumX MX1609KB |
| Number of exhaust gas particles | particle counter | AVL Particle Counter: APC 489 |
Technical data of diesel and gasoline heaters [61].
Technical data of diesel and gasoline heaters [61].
| Technical data | Air Cushion Evo 55 | |
|---|---|---|
| diesel engine | gasoline | |
| ECE approval number ECE R122 (heating system) | E1 00 0386 | |
| ECE Approval NumberECE R10 (EMC) | E1 05 5529 | |
| Heat output, control range/voltage boost [kW] | 1.5–5.0/5.5 ** | 1.7–5.0/5.5 ** |
| Fuel consumption, control range/boost [l/h] | 0.18–0.61/0.67 ** | 0.25–0.70/0.80 ** |
| Rated voltage [V] | 12 | twenty four |
| Rated power consumption, control range/boost [W] | 15–95/130 ** | |
| Heating air flow relative to 0.5 mbar, control range/pressure rise (m3/H) | 200/220** | |
| fuel*** | Diesel EN 590 B100 Honor EN 14214 [10] Who are youEN 15940 [66] |
E0-E10EN 228 |
| range of working temperature [°C] | −40 to +40 | |
| Dimensions length × width × height [mm] | 423×148×162 | |
| weight [kg] | 5.9 | |
| Automatic height compensation [m] | 2200 | |
Table 4.
The average of the normalized mass percentages of elements found in three test soot samples.
Table 4.
The average of the normalized mass percentages of elements found in three test soot samples.
| C | oxygen | F | zinc | calcium | magnesium | chlorine | nitrogen | phosphorus | S | |
|---|---|---|---|---|---|---|---|---|---|---|
| [m/m%] | ||||||||||
| E10 | 92.18 | 6.34 | 0.64 | 0.56 | 0.09 | 0.06 | 0.04 | 0.03 | 0.02 | 0.02 |
| E30 | 88.54 | 9.20 | 1.18 | 0.70 | 0.11 | 0.10 | 0.05 | 0.04 | 0.04 | 0.03 |
table 5.
Particle number related parameters.
table 5.
Particle number related parameters.
| Investigate fuel | E10 | E30 | E100 | B7 | EURO 5-6 emission limits [55] | |
| 1800 seconds fuel consumption [kg] | 0.2546 | 0.2590 | 0.2690 | 0.2934 | ||
| Particle emission during 1800 seconds [#/cycle] | 9.56×10⁸ | 4.83×10⁸ | 1.65×10⁸ | 3.92×10¹⁰ | ||
| Number of particles per kilogram of fuel [#/kg × cycle] | 3.76×10⁹ | 1.87×10⁹ | 6.14×10⁸ | 1.34×10¹¹ | forced ignition | compression ignition |
| particles per kilometer [#/km] | 9.56×10⁷ | 4.83×10⁷ | 1.65×10⁷ | 3.92×10⁹ | 6×10¹¹ | 6×10¹¹ |